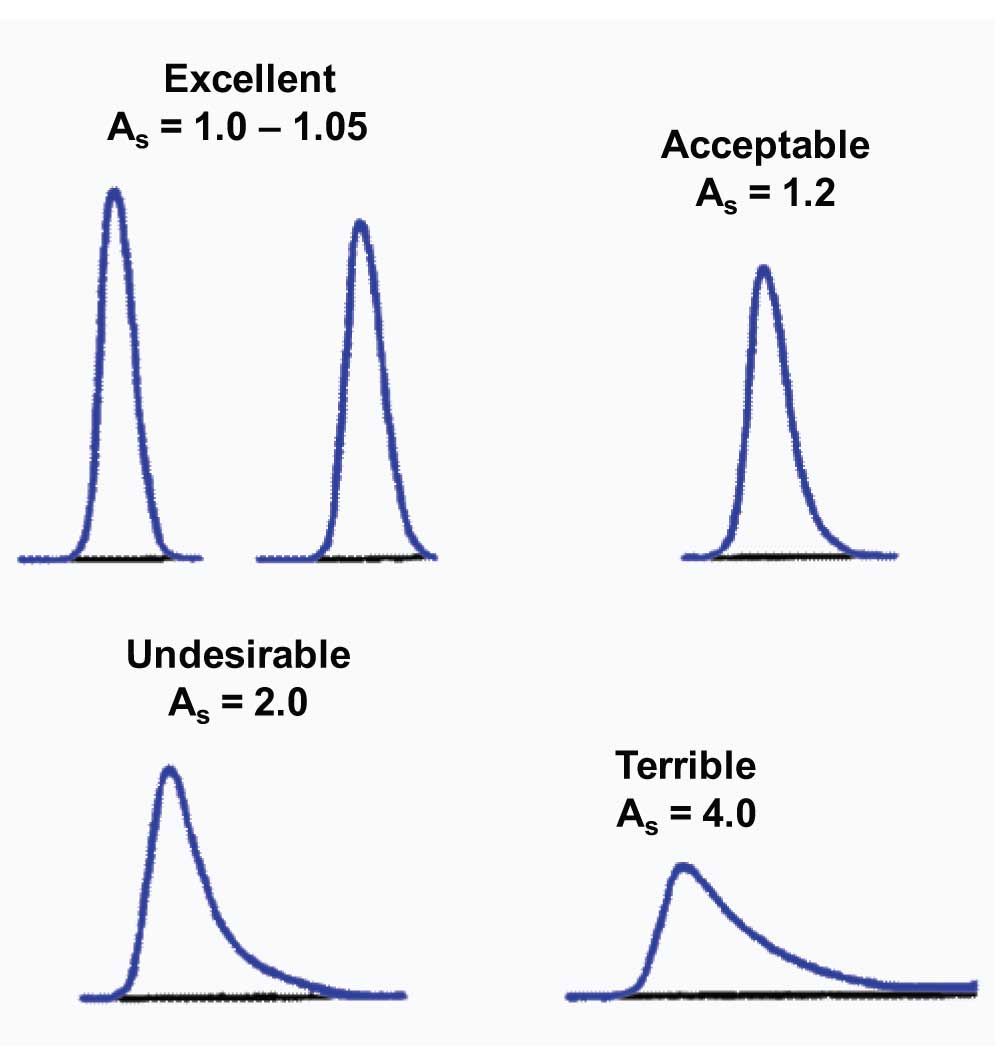
In an earlier article we examined how to calculate peak tailing. This issue, let’s take a closer look at some examples of peak tailing and see what they have to say in practical terms. For purposes of discussion, let’s consider the peaks in Figure 1, showing various degrees of tailing (asymmetry factor, As, used to calculate tailing).
A new column may exhibit a little peak tailing or fronting. Many manufacturers have column-release specifications from their quality control (QC) program that allow tailing of 0.9-1.2. This means that the peak may front or tail a bit and be perfectly OK. Such peaks are represented by the two examples at the top of Figure 1.
 Figure 1
As the peak tailing increases, we become less and less happy with the results. If I consider the regulatory guidelines, peak tailing of up to ≈2.0 is allowed without raising too much concern. I have labelled peak tailing of 2.0 as undesirable (lower left of Figure 1), because even if it is allowed, I don’t like peaks that tail that much.
Although I might instigate a debate about the acceptability of a peak with tailing of 2.0, I doubt if I will get much disagreement that the peak in the lower right of Figure 1, with tailing of 4.0, should be avoided if at all possible. Peaks with this much tailing are fraught with potential problems. Let me count the ways…
Integration . HPLC data systems determine the start and stop of a peak by looking at the change in slope of the baseline or the number of data points in a row that increase or decrease. This peak-detection process is fairly simple if the peak rises or falls steeply at the baseline, as with peaks with little fronting or tailing. But you can see that the tail of the problem peak decreases so gradually that it is difficult to determine when it reaches the baseline. Compound this by reducing the peak size, increasing the baseline noise, and/or adding baseline drift to the chromatogram and it will be very difficult to consistently locate where the peak ends. This could mean that equivalent peaks may give different peak areas. While it is unlikely that the difference in peak area between peaks will be significant, it certainly does not look very good when you show such peaks to reviewers and the peak-end marker dances back and forth from one run to the next.
Limits . The limit of detection (LOD) and lower limit of quantification (LLOQ) are influenced more by peak height than peak area. It is the signal-to-noise that is the critical factor, and this reflects the peak height, not area. As a result, if the peak areas are constant for all the peaks in Figure 1, it is easy to see that the LOD and LLOQ are more than twice as large for the peak in the lower right compared with the one in the upper left.
Resolution and run time . If we have a requirement of a minimum resolution between two peaks, as is often the case, the peaks must be farther apart when peak tailing is present. This means that if baseline separation is required, the run must be longer to have adequate separation with tailing peaks.
Peak purity . It is nearly impossible to tell if a peak is pure when the impurity is small compared with the major peak and if it has similar detector response (e.g., UV spectrum). However, closely eluted peaks, such as a small peak following a large one, can generate a single peak that looks like it has a tail. If the spectra are similar for the two peaks, it is very hard to figure out if the tail results from the presence of a second peak or distortion of a single, pure peak. As a result, we have much less confidence in peak purity when peak tailing is present.
There probably are other features of the badly tailing peak that make it something we do not want in our chromatograms. Fortunately, in most cases, peak tailing can be minimized by using high-purity, type-B silica columns and controlling the mobile phase chemistry, such as by using enough buffer at the appropriate pH. To read more about some of the column-related factors that influence tailing, refer to 'Silica Purity #1 – Metals' and 'Silica Purity #2 – Silanols'.
This blog article series is produced in collaboration with John Dolan, best known as one of the world’s foremost HPLC troubleshooting authorities. He is also known for his research with Lloyd Snyder, which resulted in more than 100 technical publications and three books. If you have any questions about this article send them to TechTips@sepscience.com


