Interferences exist in every chromatographic analysis whether they are recognized or not. Interferences can be visible in your chromatogram and present themselves as reduced peak area counts, split peaks, shoulders around the peak, or peak disappearance. Sample preparation techniques are an effective solution to fix the problems associated with your chromatograms. However, there are instances when you don’t realize that your results are affected by these interferences. In other words, your peak looked great a couple of months ago, and now you have different retention times or varying peak area counts with greater relative standard deviation (RSD). Unusually increased system backpressure in liquid chromatography (LC) is also an indicator of presence of interferences. This means that a poor method could have gone through the validation process.
The difficulties in method validation explained above are commonly encountered in biological sample analysis where there are inherent interferences coming from a variety of endogenous materials such as proteins, peptides, lipids, salts, particulates, and so on. Many biological sample analyses are performed by liquid chromatography combined with single or tandem mass spectrometry (LC–MS or LC–MS–MS). All of the endogenous materials can contribute to ion suppression by either a competing ionization process in the ionization source or by contaminating the system. To remove these interferences during robust and rugged method development, one can employ many different sample preparation techniques including liquid-liquid extraction (LLE), solid-phase extraction (SPE), filtration, protein precipitation, and other methods. Each individual technique provides a different set of capabilities and limitations for interference removal.
Why is Ion Suppression So Bad?
Simply running a biological sample and looking at the chromatogram will not tell you if you are actually experiencing ion suppression. At first you may have a nice-looking chromatogram from your LC–MS analysis with great peak shape and symmetry, even if there is substantial ion suppression. You can continue to develop a method based on your chromatographic conditions and initial results. Calibration curves show great linearity in your desired concentration range, and precision and accuracy data confirm that your method is good. However, as your project moves along, you might observe changes in your system performance such as reduced sensitivity and increased %RSD. Finally, your accuracy and precision become questionable, resulting in the inability to validate the method. There are many tips and tricks to troubleshoot these symptoms. Replacing your current analytical column, adding a guard column, cleaning your system, preparing new mobile phase, and replacing the tubing in your system, are the typical routes you might take. These will cost money and time and could delay your project significantly. In addition, you might have to repeat the troubleshooting once or more. Why not prevent this problem from the beginning to save time and money and keep your project on schedule? The following sections cover the various approaches used to troubleshoot for ion suppression.
How Do You Measure Ion Suppression and How Do You Remove It?
In this section, let’s go over how to visualize ion suppression in your bioanalysis first, and then discuss how to remove endogenous materials to avoid ion suppression in your LC–MS–MS analysis.
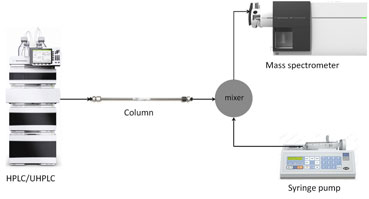
Figure 1: Schematic of a post-column infusion experiment for measurement of ion suppression.
To see where ion suppression is happening in your chromatogram, it is critical to perform a post-column infusion experiment. Schematics of a post-column infusion experiment are shown in Figure 1.
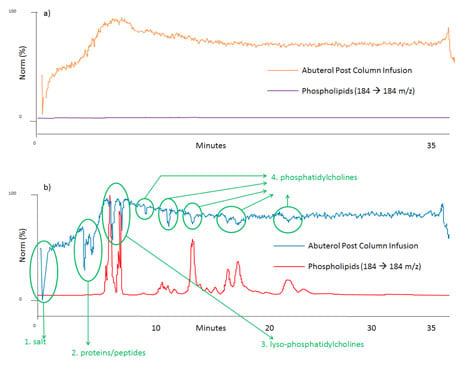
Figure 2: Post-column infusion of albuterol and phospholipids trace (a): when blank mobile phase was injected, b): when human plasma sample was prepared by protein precipitation injected. The locations of ion suppression and the cause of ion suppression are shown in green.
A post-column infusion experiment is almost the same as your typical LC–MS–MS setup but with a mixer teeing syringe pump and mobile phase flow path. Fill the syringe with your compound standard in the solvent. Run your LC–MS–MS method as usual, but with extended column washing step at high organic mobile phase, then turn on the syringe pump, and inject a blank mobile phase sample that will not have any endogenous interference. The syringe pump will deliver your compounds of interest (in this case albuterol) continuously to your LC–MS–MS system, and you will have a relatively stable MS signal without ion suppression as shown in orange in Figure 2 (a). From the beginning to about the 7 min region, the MS signal increases gradually, which is due to increased organic mobile phase during the gradient helping the ionization process in the ionization source. Likewise, the signal drop in the very last part of the chromatogram is due to mobile phase composition changing to its initial condition. The purple line is a phospholipids trace and it will be discussed shortly. On the contrary when the same post-column infusion is performed with biological sample injections such as plasma, serum, urine, etc. in place of a blank mobile phase, ion suppression can be observed during the analysis. For example, the blue trace in Figure 2 (b) is the MS signal of albuterol by post-column infusion and it experiences several signal drops and ion suppression, from the beginning to the end of the run. In this case non-spiked blank human plasma sample prepared by protein precipitation was injected. You can choose your own sample preparation technique to see how much of ion suppression you experience in the analysis. It’s then time to run one more sample to get another chromatogram, shown in purple in Fig 2 (a) and in red in (b), respectively, with identical LC–MS–MS conditions. To obtain the red chromatogram in Figure 2 (b), inject a non-spiked blank plasma sample prepared by protein precipitation (or your own sample preparation method) without a syringe pump just like your routine bioanalytical run. Monitor the 184 →184 m/z transition throughout the run.
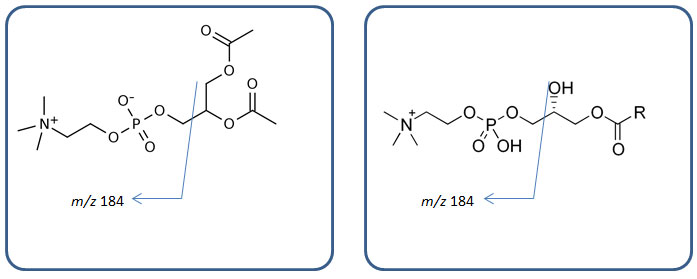
Figure 3: Generic structures of phospholipids (left, phosphatidylcholines; right, lyso-phosphatidylcholines) and their m/z 184 fragments.
It is a representative fragmentation of phospholipids in biological samples, as shown in Figure 3. Phospholipids are monitored throughout the run and their trace is shown in purple and red in Figure 2 (a) and (b), respectively. In Figure 2 (b) if the blue signal drops, it means something is suppressing ionization of your compounds; hence ion suppression. The very first dip around t0 in the blue trace is ion suppression due to salt in the plasma sample. The big double dip around 4 to 5 min is due to soluble proteins and peptides. This provides strong evidence that protein precipitation is not capable of removing all proteins and peptides in your biological samples. Another huge ion suppression dip near 7 to 8 min comes from phospholipids, specifically lyso-phosphatidylcholines (LPC). Several other noticeable ion suppression regions are present from the 9 to 23 min region. These are ion suppressions caused by different phospholipids, i.e. phosphatidylcholines (PC). Each ion suppression region and its cause are shown in green in Figure 2 (b). No ion suppression is shown when solvent blank sample is injected during post-column infusion as we can see in Figure 2 (a); no phospholipids shows up in the chromatogram (flat purple trace) and no MS signal loss is realized (orange trace). By comparing these two sets of chromatogram overlays (Figure 2 (a) and (b)), you can visualize where and how much of ion suppression is present in your run.
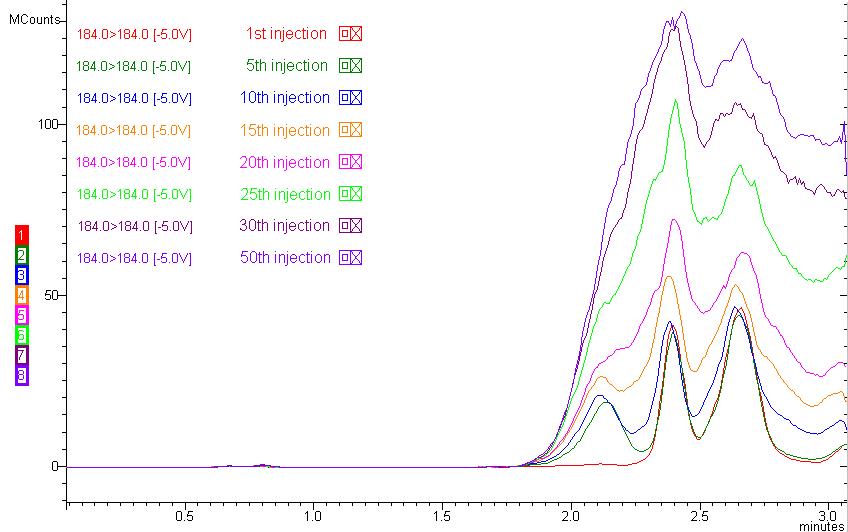
Figure 4: Lipid buildup during 50 injections of human plasma samples (184 184 m/z is monitored as a representative phospholipid MRM).
An immediate effect of ion suppression caused by endogenous materials in biological sample analysis is reduced peak area count. If the retention time of your compound is located around the ion suppression region, it is obvious that your peak area count will be reduced compared to standard injection with no endogenous materials. A long-term effect of ion suppression would be the accumulation of the endogenous materials in your column and system, resulting in frequent column replacement due to unusual backpressure increase, sensitivity drop, cross-talk in MRM between analyses, and carryover. For example, if the lipids in your biological sample are not removed, they will build up in your column, as shown in Figure 4. Figure 2 has a 35-min runtime to accommodate the retained lipids in a conventional reversed-phase column, but practically speaking, most bioanalytical runs, especially with the emergence of UHPLC systems, are approximately 5 min depending on your LC system. Imagine what will happen if you stop the run at 5 min and inject the following samples. You can predict that all lyso-phosphatidylcholines and phosphatidylcholines will not yet elute from the previous injection and will accumulate in your column if your run stops at 5 min. Accumulation of phospholipids is shown in Figure 4. You may not see a great decrease in MS signal at first, but as the number of injections increases, the effect of ion suppression will increase as well.
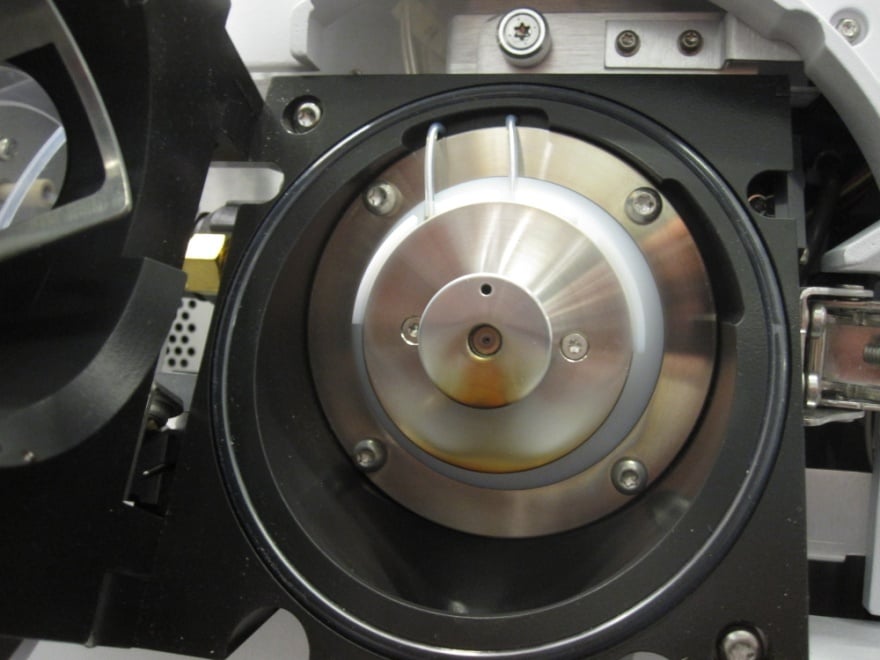
Figure 5: Ionization source after 3000 injections of urine samples prepared by ‘dilute-and-shoot’.
How can you avoid these unwanted effects in your method? Cleaning your sample by removing endogenous materials prior to injection is the most effective and economic way. That’s why sample preparation plays a very important role in your analysis.
Many laboratories still use ‘dilute-and-shoot’ sample preparation due to its ease-of-use. Dilute-and-shoot is simply the dilution of biological samples. Consequently, it does not remove any endogenous materials or the compounds of interest. Dilute-and-shoot lowers the volume density of both endogenous materials and analytes of interest by a predetermined dilution factor. With this method, significantly lowered instrument performance can be observed eventually, if not immediately. Figure 5 shows what this looks like when dilute-and-shoot injections are performed. It is apparent that cleaning the ionization source and lenses is required. The lifetime of your entire system may be greatly shortened. This includes HPLC columns, tubing, spray needle, capillary, lenses, electron multiplier, and other components in the flow path or ion path. Typically, dilute-and-shoot will not remove any of ion suppressions shown in Figure 2 (b), and it is not recommended for routine analysis.
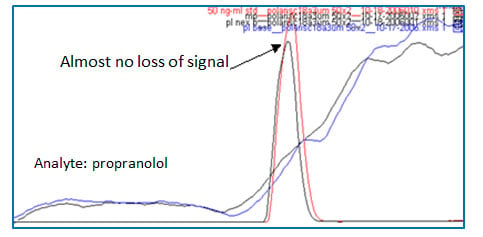
Figure 6: Freedom from ion suppression caused by endogenous materials when spiked human plasma sample was prepared by solid-phase extraction (red peak: solvent standard injection, black peak: spiked human plasma sample prepared by solid-phase extraction, blue trace: post-column infusion of compound with blank mobile phase injection, black trace: post-column infusion of compound with blank human plasma sample injection prepared by solid-phase extraction. Refer to Fig 1 for post-column infusion experiment for clarification.
Now let’s take a deeper look at each ion suppression in Figure 2 (b). There are four major ion suppressions shown in green in Figure 2 (b). The causes of ion suppression and appropriate sample preparation methods to overcome them are discussed below.
The first ion suppression shown in Figure 2 (b) is caused by salt (#1). In LC–MS–MS bioanalysis, interferences coming from the presence of salt are not as damaging as they are in GC analysis. Ion suppression by salt typically occurs around t0 and does not usually affect peaks of interest since most of the retention times of compounds will be later than t0. Also, salt residues can be washed out by solvents, such as alcohol/water mixtures (using methanol, isopropanol, or other alcohols) when your system is not severely affected with salt deposit. However, if you are worried about the salt in your analysis, LLE is a good method to remove salts since they will remain in the aqueous layer, while your compounds of interest will migrate to the organic layer, which will then be injected after proper solvent exchange when needed [1]. LLE is an easy sample preparation method especially when your sample is aqueous like urine. The downside of this method is that conventional scale LLE requires expensive and dedicated glassware accompanied by thorough washing every time you perform LLE. Also, sometimes emulsions can form between the aqueous layer and the organic solvent layer during shaking, and these may be difficult or impossible to remove. Another drawback is that LLE is not suitable for automation. Miniaturized LLE in 96-well plate format can have limited efficiency when in-well mixing is not as thorough as large-scale LLE. An effective alternative LLE is solid-supported liquid-liquid extraction (SLE). Its mechanism is exactly the same as conventional liquid-liquid extraction except that SLE is supported by solid particulate diatomaceous earth material. SLE comes in cartridge and 96-well formats to suit your throughput level and cannot form emulsions because there is no vigorous shaking step as in conventional LLE [2].
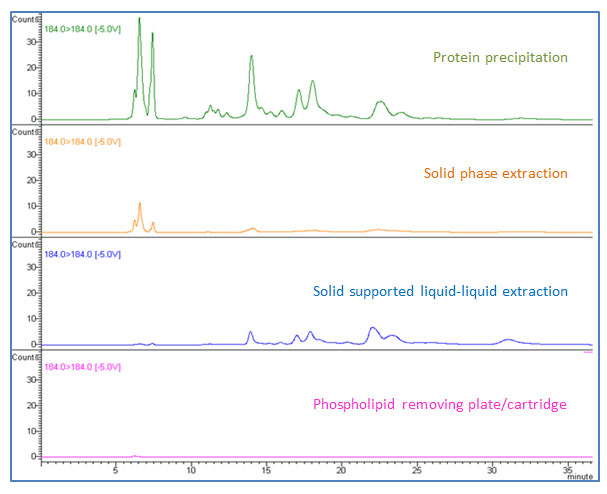
Figure 7: Performance of phospholipid removal by different sample preparation techniques (184 184 m/z is monitored as a representative phospholipid MRM).
The second ion suppression shown in Figure 2 (b) is caused by proteins and peptides (#2). This is one of the biggest interferences commonly encountered in bioanalysis. Protein precipitation followed by centrifugation is one of the most widely used sample preparation methods due to its low upfront cost. Usually, biological sample is diluted with a mixture of organic solvent such as acetonitrile or methanol with water in a ratio of 2:1 to 10:1, followed by vortexing and centrifugation. After centrifugation the supernatant is transferred to an autosampler vial for analysis (solvent exchange can be performed if needed). However, as can be seen in the blue trace in Figure 2 (b), there is still ion suppression caused by proteins and peptides. Protein precipitation does remove a large proportion of proteins and peptides in biological samples, but it does not remove them completely. If your peak of interest elutes around that area, your compound will suffer from the ion suppression. In this case SPE can be a superior option. In Figure 6, there are two peaks, one in red, and the other in black. The red peak was obtained when solvent standard sample (no endogenous materials) was injected. The black peak was obtained when a spiked human plasma sample prepared by SPE (endogenous materials were removed) was injected. Almost no loss of signal exists between the two injections. This means there is no interferences during the run and this is verified by a post-column infusion experiment shown as blue and black traces in Figure 6. (refer to Figure 2 and the corresponding paragraphs for the post-column infusion experiment.)
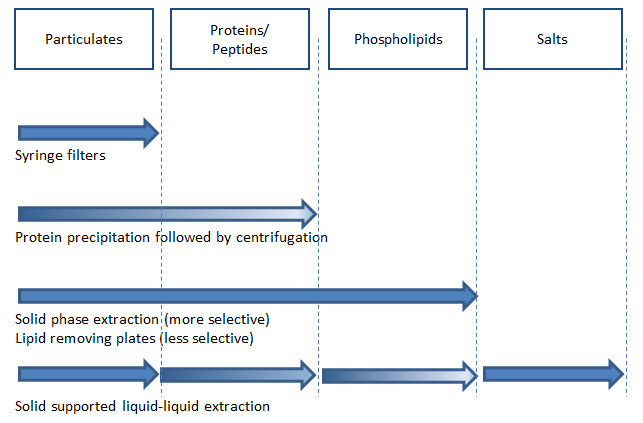
Figure 8: Sample preparation methods in biological sample analysis using LC–MS–MS and their ability to remove endogenous materials that cause ion suppression (gradient in arrow indicates limited removal of corresponding endogenous materials; the degree of removal varies between types of products).
The third and the fourth ion suppression effects originate directly from the presence of lyso-phosphatidylcholines and phosphatidylcholines, respectively, as shown in Figure 2 (b) (#3 and #4). Protein precipitation creates an environment of high organic solvent ratio by its method (dilution of biological sample with organic solvent such as acetonitrile or methanol at 2:1 to 10:1). Under this condition, lipids are soluble. When you transfer the supernatant after centrifugation, lipids will remain in the supernatant and will be transferred together with your analytes. The important point in this step is that phospholipids are not visible in supernatant. Your sample will look clear after centrifugation, but the clear supernatant still contains all phospholipids from your biological sample and they will cause ion suppression in your analysis, as demonstrated in Figure 2 (b) (#3 and #4 in green). There are several options for phospholipid removal. As discussed earlier, SPE shows great performance in phospholipid removal in addition to protein removal capability. SPE products usually come in cartridge, 96-well-plate, and pipette-tip formats in a variety of different sizes to accommodate various sample volumes. For the past few years, specifically designed sample preparation products targeting phospholipid removal have gained a great amount of attention and have been used in various industries including pharmaceutical, food, and clinical research [3–6]. These products come in cartridge and 96-well-plate formats and the main concept is non-drip, in-well protein precipitation followed by direct in-well filtration via vacuum (or positive pressure) without transferring sample. In-well protein precipitation can be performed by simple pipette mixing. During the filtration step, lipids are stripped and retained in the sorbent, while the biological sample elutes from the cartridge or plate. The eluate is ready for injection, or solvent exchange can be done if needed before injection. Some products have surfactant removal capability as well. The advantages of this kind of product include simple methodology, no sample transferring, no pre-conditioning or washing steps unlike solid-phase extraction, and high throughput capability for automation. Previously mentioned solid-phase extraction (SPE) and solid supported liquid-liquid extraction (SLE) also remove phospholipids effectively. Figure 7 shows phospholipid traces when non-spiked blank human plasma was prepared by different sample preparation techniques. It should be noted that phospholipid removal is part of a good method development and validation process, and the recovery of your compounds of interest needs to be compared simultaneously. Loss of analytes may happen at any time when interference removal is involved and the best sample preparation technique is to balance between removing interferences and keeping your compounds of interest.
A successful method means that the entire analytical procedure is consistent from sample preparation to data analysis. These days we have access to highly sensitive instruments, fully organized data systems, superior columns with great efficiency and lower backpressure, and many different sample preparation techniques and products. For accurate, consistent, and reproducible data generation, appropriate sample preparation is a critical component in your analysis because it is the very first part of analytical method development. As such it can affect your method development components ranging, from HPLC columns, LC–MS–MS system, data interpretation etc. Figure 8 lists the types of endogenous materials in biological samples and summarizes the effective removal methods.
References
1. Somenath Mitra (ed.) Sample Preparation Techniques in Analytical Chemistry, Chapter 2.2. John Wiley & Sons, Hoboken, NJ, USA (2003).
2. Ronald Majors, Supported Liquid Extraction (SLE): The Best Kept Secret in Sample Preparation, LCGC (Aug, 2012).
3. Mike Chang. Agilent Technologies, Inc. Application Note 5991-1996EN.
4. Mike Chang. Agilent Technologies, Inc. Application Note 5991-1999EN.
5. Irina Dioumaeva. Agilent Technologies, Inc. Application Note 5991-2230EN.
6. Edgar Naegele. Agilent Technologies, Inc. Application Note 5991-2252EN.


