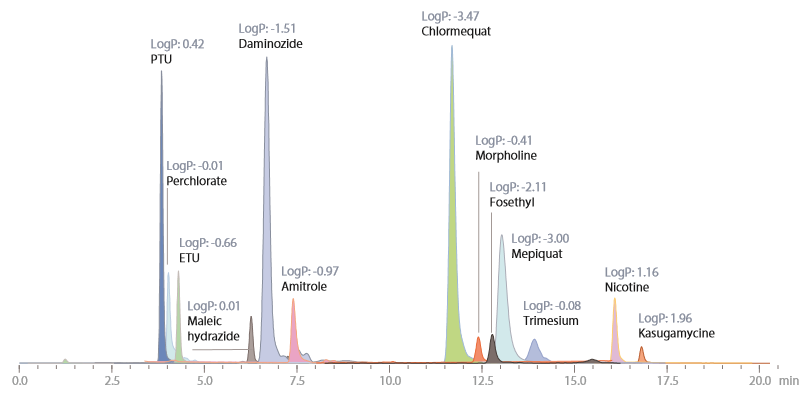
Shimadzu has produced an application note demonstrating an example of batch analysis of highly polar pesticides using SFC that may be effective for analyses for which retention and separation are difficult in LC.
 Introduction
Since achieving sufficient retention and favorable separation in normal batch analysis of highly polar pesticides has proved difficult due to their chemical characteristics, a number of individual analysis methods are employed for LC-MS/MS analysis. All of these methods have restrictions on the chemical compounds that can be analysed together and this remains a problem.
On the contrary, supercritical fluid chromatography (SFC) has the advantage of being able to separate a wide array of chemical compounds at once due to the characteristics of the mobile phase that is used. This application note introduces an example of batch analysis of highly polar pesticides using SFC.
EURL-SRM (Stuttgart, Germany), an EU Reference Laboratories member in charge of individual analysis method development, is developing a batch analysis method called "QuPPe (Quick Polar Pesticides)" for highly polar pesticides that are difficult to analyse using pretreatment with the QuEChERS method as well as normal batch analysis methods. This method proposes multiple methods to suit each sample and target chemical compound (M. Anastassiades et al; QuPPe of EURL-SRM (Version 9.1; 2016)).
 Sample Preparation and Analysis
Flaxseed and lemon were used as food samples and extraction was performed using a method compliant with QuPPe. (The extracts were provided by Concept Life Sciences, a contract analytical laboratory located in the UK). Standard solution of highly polar pesticides was added to these matrix solutions, which were then directly injected into the SFC-MS/MS.
Quantitative Analysis of Highly Polar Pesticides
In order to verify the quantitative performance of the developed SFC/MS analysis method, matrix calibration
curves were created using each food extract to which standard solution of the highly polar pesticides was
added. The calibration curve range was 10 to 200 ppb and accuracy was verified using the internal standard method regarding components for which an internal standard substance labelled with a stable isotope was obtained.
The calibration curve created for each sample showed favorable linearity for all chemical compounds regardless of the sample matrix.


