In the previous MS Solutions we discussed MS/MS fragmentation of polypeptides, the types of ions formed, and the mechanism of their formation. In this part we will examine a tandem mass spectrum of a simple polypeptide and step through an interpretation strategy leading to the complete sequence determination.
To help you in understanding the interpretation process we have provided a table of the 20 naturally occuring amino acids. Click on this link (Table 1) and the table will open as a PDF file in a separate window so you can refer to it as you read the rest of this article.
The headers on the table, reading from left to right, are:
1. Amino acid name and residue composition (a “residue” is the amino acid minus water)
2. The two commonly used abbreviations, i.e. the three-letter and the single-letter forms
3. The amino acid residue nominal (integer) mass, monoisotopic mass, and average mass
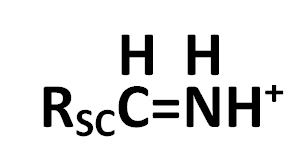
4. The immonium ion nominal mass; immonium ions have this form

where RSC is the side chain.
5. Side chain nominal mass
6. Structure of the amino acid
The table is divided into three sections according to the polarity/ionic nature of the amino acid side-chain.
MS/MS experiments with tandem transmission quadrupole (“triple quad”), instruments, quadrupole ion traps, and Q-ToF or IT-ToF hybrids employ low-energy CAD (collisionally-activated dissociation). Low-energy CAD of polypeptides results largely in formation of b and y ions, i.e., ions formed by cleavage of the peptide bonds. b ions are often accompanied by their corresponding a ion as well. (High-energy CAD will be discussed in a later instalment in this series.)
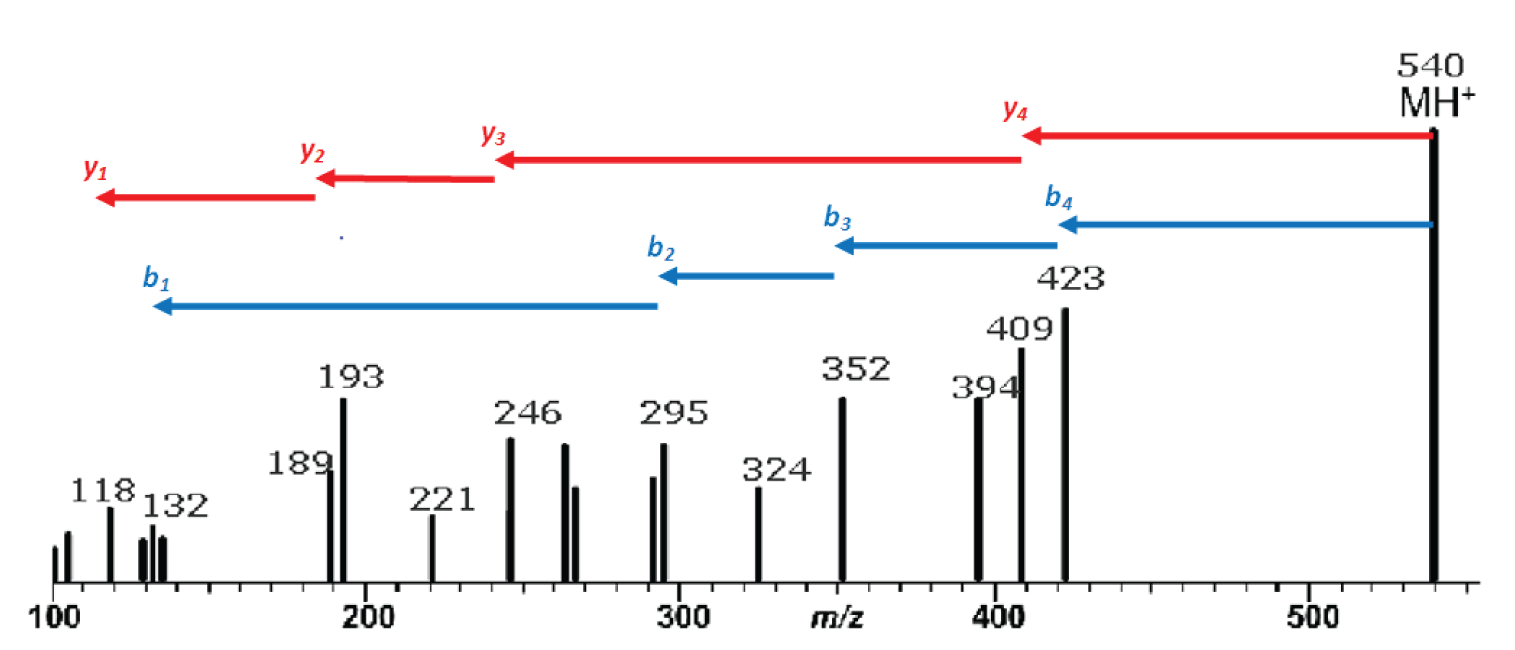
 Figure 1: Mass spectrum resulting from the MS/MS fragmentation of a single-charge peptide precursor ion of m/z 540. Red arrows indicate identification of y ion series; blue arrows are the b ion series.
Our example peptide is the same one we looked at last month with the sequence methionine-tyrosine-glycine-alanine-valine, or MYGAV. The protonated molecule of this polypeptide has a nominal mass and mass-to-charge ratio (m/z ) of 540 and will be used as the precursor ion in our MS/MS experiment. Figure 1 is the mass spectrum resulting from this experiment.
In a low-energy CAD experiment we start by looking for the y and b series of ions. The first, or highest mass, y ion is identified by finding the neutral loss is of a single amino-acid and residue mass from the precursor ion. In other words this neutral loss must be between 57 (glycine) and 186 (tryptophan). Because the y ions are C-terminal product ions, this neutral loss represents the first N-terminal amino acid residue.
The first b ion results from the loss of a single amino-acid residue mass plus 18 from the precursor. Because b ions are N-terminal product ions, the neutral loss of the first C-terminal amino acid will contain the C-terminal –OH plus an additional hydrogen which accounts for the 18 additional mass units over the residue mass.
Once the first ion in each series is identified, the subsequent ions in the series are identified by finding a peak in the mass spectrum which represents the neutral loss of an amino acid residue mass from the immediately preceeding peak in the series.
This differs from classic mass spectral interpretation in which we usually look for neutral losses from the precursor ion.

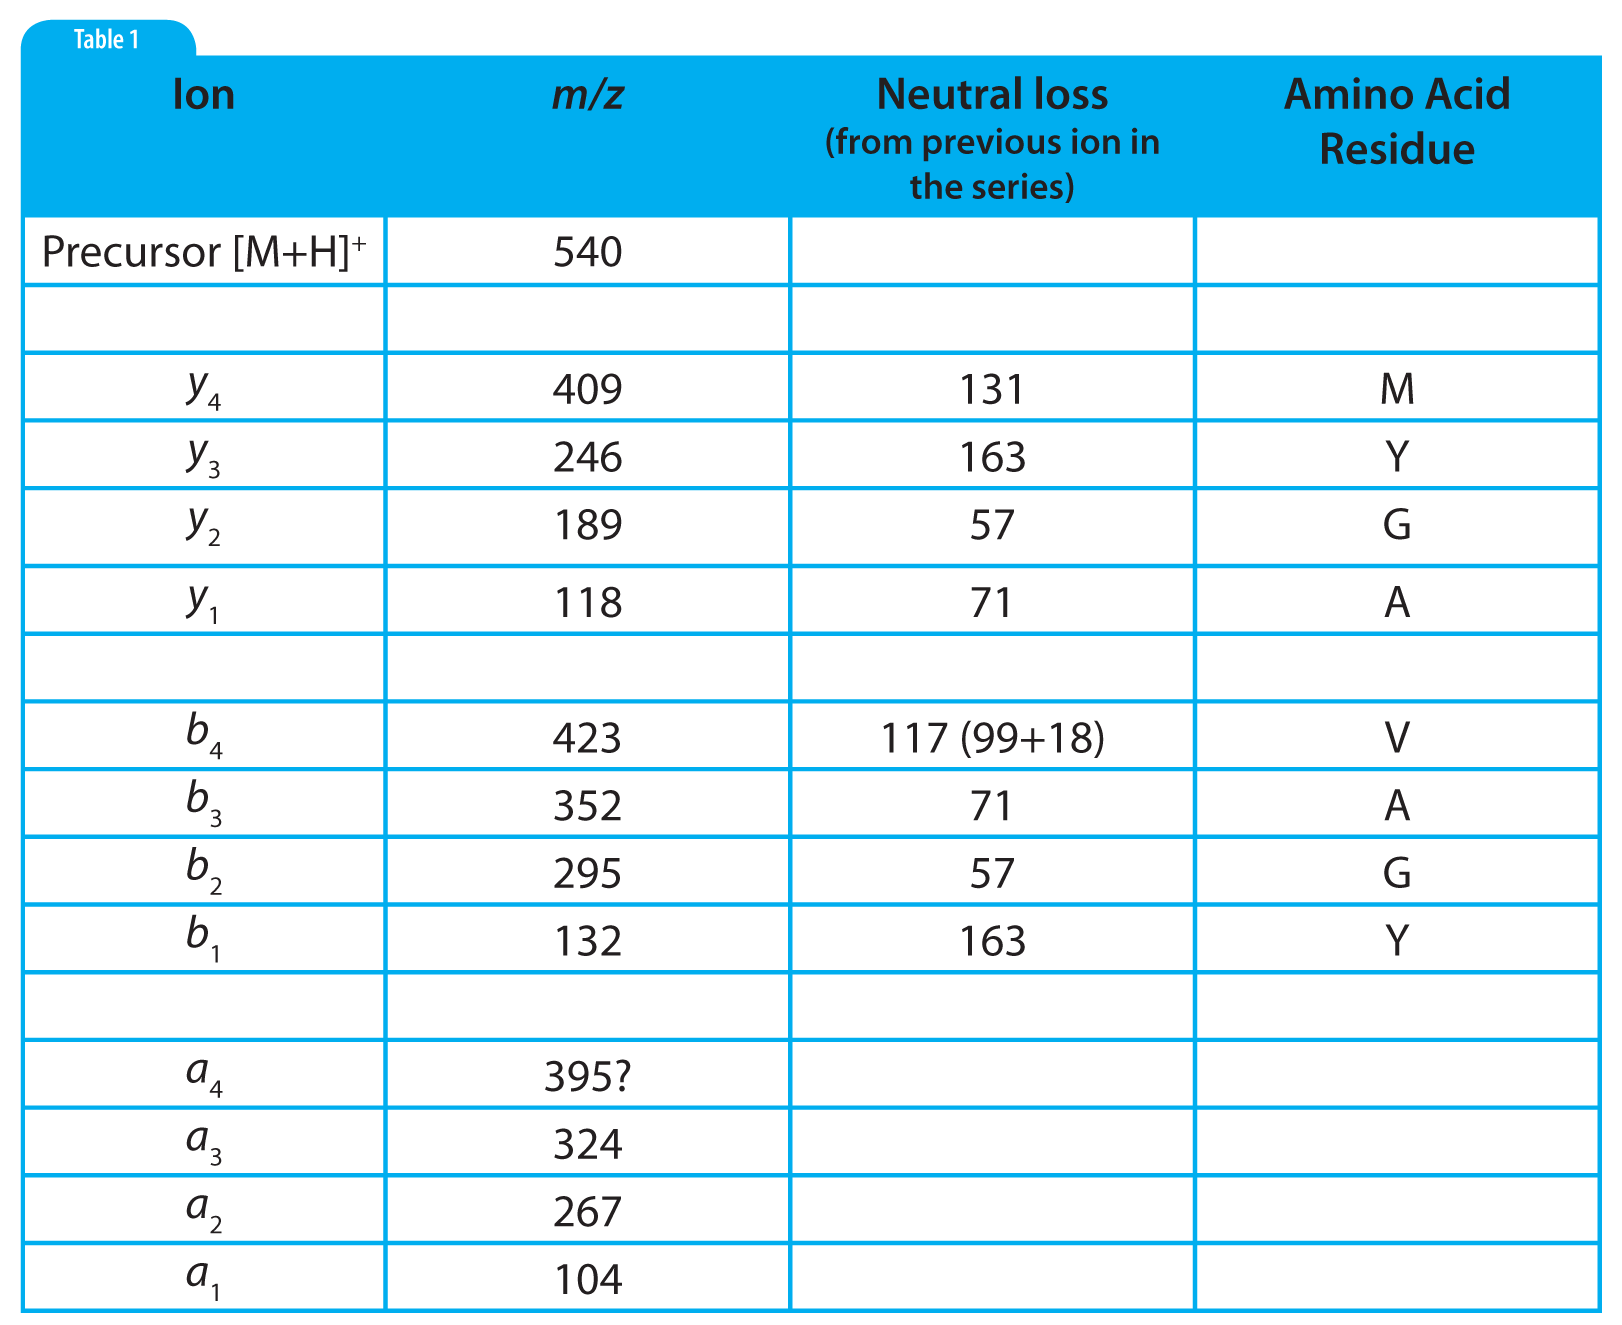
Table 2: Tabular summary for the interpretation of the mass spectrum shown in Figure 1.
The interpretation of the mass spectrum is shown graphically in Figure 1 and in tabular form in Table 2. Looking first at the y ion series: the first y ion is identified by noting a peak at m/z 409 which represents a neutral loss of 131 from the precursor ion. Refering to Table 1, we find that 131 is the residue mass of methionine. So we can tentatively assign methionine as the N-terminal amino acid in this polypeptide. Realizing that these assignments are tentative at this early stage in the process is important. We may find that things do not add up and that we are forced to start over.
Subsequent y ions are identified in the same way, i.e., observing a neutral loss which is equivalent to an amino acid residue mass. Referring to Figure 1 and Table 2, we find the y series of ions gives us the sequence M-Y-G-A-. The y 1ion represents the C-terminal amino acid residue which is identified by subtracting 19 from the y <sub> 1 ion mass (17 for the C-terminal –OH, 1 for the N-terminal –H and 1 for the proton which imparts the +1 charge). This results in a residue mass of 99 which we can determine from Table 1 is valine. We are fortunate to observe a complete series of y ions which give us the complete polypeptide sequence of MYGAV.
We identify the first b ion at m/z 423 by looking for the neutral loss of a residue mass +18. This residue mass is 99 or valine which corresponds to the identification of the C-terminal amino acid which we made based on the y 1 ion. That’s good news; we are on the right track! The subsequent b ions are found by looking for neutral losses which correspond to residue masses and thus we find (reading from the C-terminus), V-A-G-Y-. The b 1 ion at 132 represents the N-terminal amino acid residue mass plus one (to account for the proton), which is 131 or methionine, giving us a complete polypeptide sequence, MYGAV. This corresponds exactly with the results from the y series.
Note in Table 2 that a nearly complete series of a ions are also present. These are easily identified as being 28 m/z units (and 28 u), less than the corresponding b ions. The only questionable one is the a4 ion which should be at 395. The only peak observed in this mass spectrum in that region is labelled as 394. This will require us to look at the tabular data and/or expand this region of the spectrum to see if a 395 peak is present or if the peak is labelled incorrectly because of rounding.
The last and extremely important step makes certain that the mass of the precursor ion and the mass of our tentatively determined sequence match up. To complete this step, add up all of the residue masses in the sequence, add 17 for the C-terminal –OH, add one for the N-terminal –H and another one for the proton of the [M+H]+ ion. We find: 131 +163 +57 +71 +99 +17 +1 +1 = 540 which matches the selected precursor ion m/z . We’re done!
This example is designed to be simple and to work out perfectly as is appropriate for a learning environment. In the “real world”, of course most of your sequencing work will not be so straight-forward. We have found that the probability of producing any given structurally significant ion in peptide analysis is highly dependent on the sequence itself. The presence of incomplete ion series makes the interpretation more complex. Better results can often be obtained with multiple-charge precursor ions but this also adds complexity to the interpretation because product ions will be produced with varying charge numbers and thus m/ z values which may be both higher and lower than that of the precursor ion. These and other advanced topics in polypeptide sequencing will be discussed in future instalments of MS Solutions.


