We previously talked about determining limit of detection (LOD) and limit of quantitation (LOQ). I mentioned that it is important to pay attention to the detector acquisition rate and amplifier settings (if they are adjustable) since these can impact the ability to detect small peaks. This month we look at the impact of those factors in more detail.
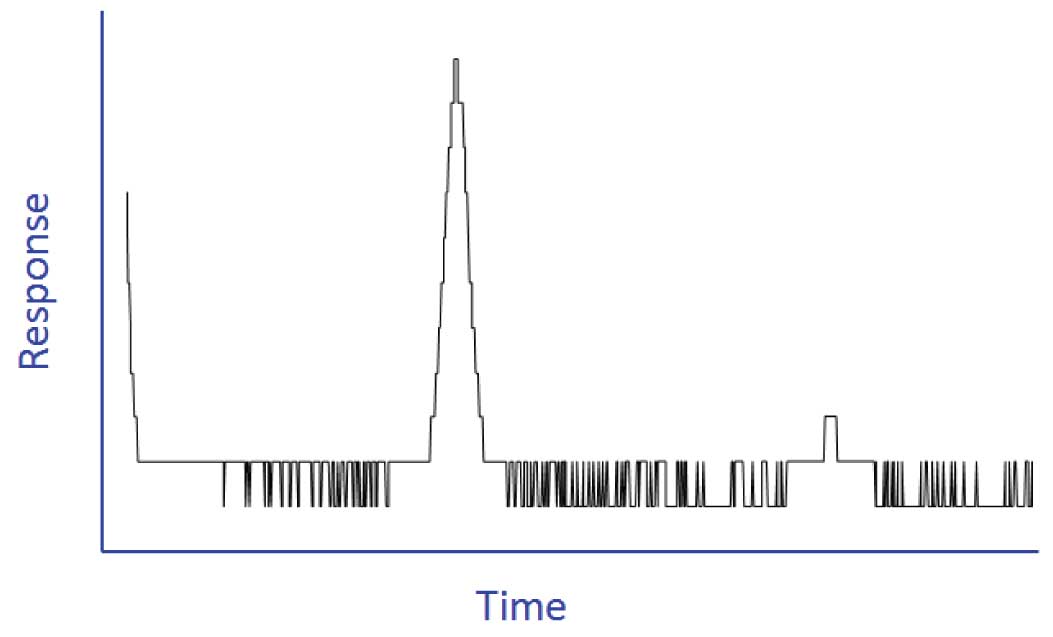
Figure 1: Noise is dominated by A/D bit noise when at the most sensitive setting, the A/D (analog to digital conversion) sampling rate is set too high, and/or there is very little or no chemical noise (clean systems or very selective detectors).
LOD is greatly tied to the background noise level of the system that includes high frequency (e.g., electronic) and lower frequency (usually chemical) noise. It is important when developing a method to be aware that choices you make in acquisition rate and range impact the LOD and precision. Figure 1 shows results for a low-level-peak when the sampling rate is set too high; the noise is dominated by A/D bit noise. In the discussion below, I discuss setpoint choices that affect the quality of the data you acquire, especially when working near the detection limits. An example is that with systems that require a detector or A/D box range adjustment, it is not possible to measure minor and major components in the same run; signals for the major components saturate (flat top or “clip”) the peaks at the most sensitive settings, leading to artificially lower peaks heights and areas as illustrated in Figure 2.
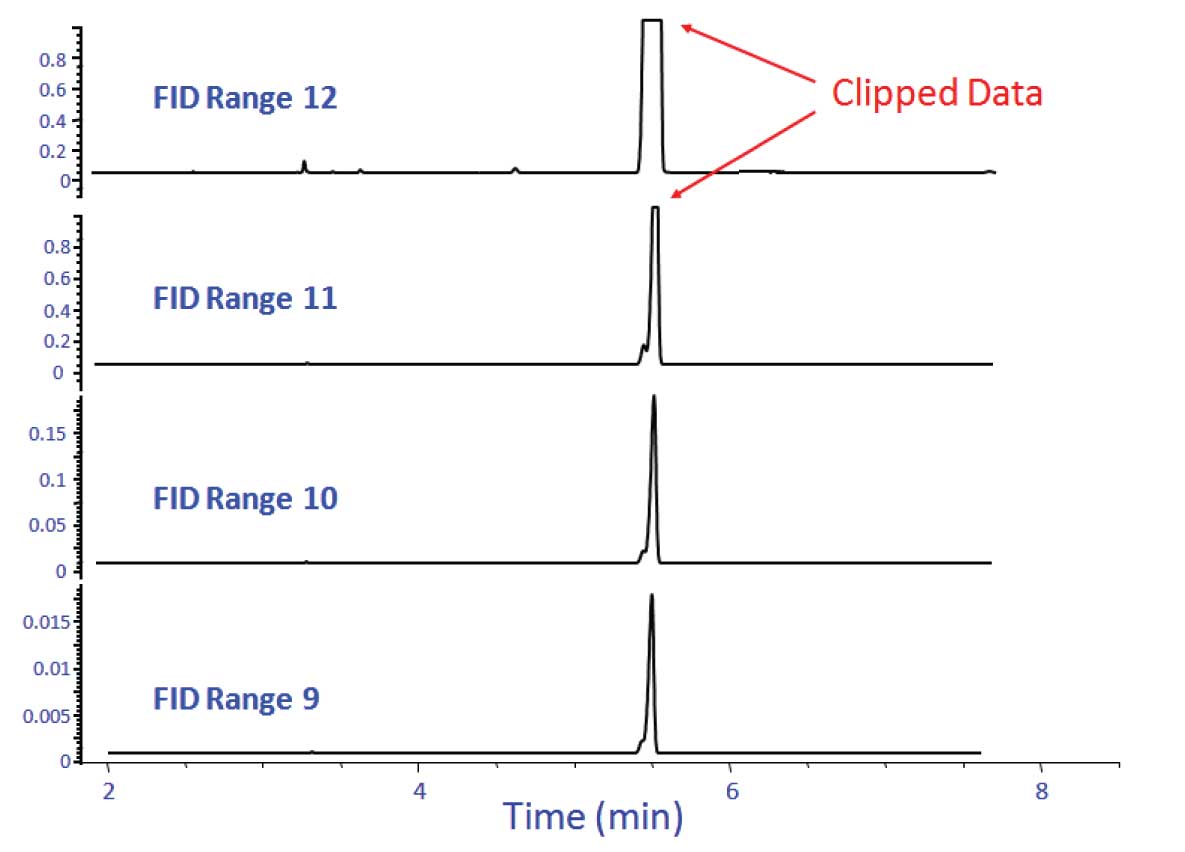
Figure 2: The major peak is clipped on ranges 11 and 12 (the most sensitive).
Data acquisition rate (sampling rate) is probably the most important detector parameter to set correctly. Figure 3 shows the impact of “oversampling” on noise. High frequency noise dominates when acquisition rate is high, making it difficult to detect and precisely integrate minor peaks. At lower acquisition rates, the electronic noise is greatly reduced, making detection of minor peaks possible and more reproducible. As shown in Figures 4 and 5, under sampling (using a rate that is too slow) broadens peaks (decreasing apparent resolution), reduces peak height (little or no more increase in S/N), makes the peaks look choppy and eventually loses small peaks into the baseline.
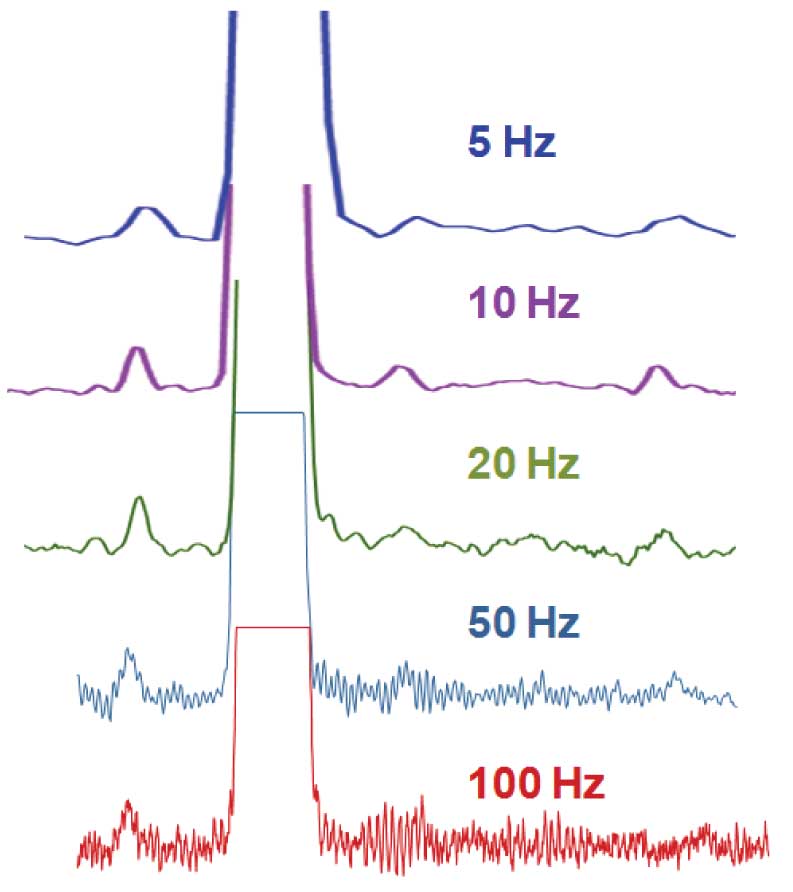
Figure 3: Proper setting of acquisition rate is essential for achieving best LOD. High frequency noise is minimized when sampling rate is slowest (assuming the detector electronics average or sum data to achieve the set rate). For the data shown, an acquisition rate of approximately 20 Hz seems best.
Most GC and MS low-level analog amplifier and A/D electronics are designed to work at the detector’s highest sampling rate. Signal processing firmware then averages or adds neighboring data to achieve the slower acquisition rate that you specify in the method parameters. For example, an FID might have a base sampling rate of 200 Hz (the fastest rate it can acquire data). To achieve a method sampling rate of 20 Hz, 10 data points are summed or averaged in firmware and the result saved as a single data point. For 5 Hz sampling, 40 points are summed/averaged, and so on. Noise is reduced by the square root of the number of points averaged or summed. So averaging 10 points yields a = 3.2 reduction in noise and potentially 3 X improvement in LOD.
In some advanced PC based data systems, one has the option to “filter” data after it has been saved using averaging or more advanced filtering. If you have access to that kind of tool software, you could efficiently investigate impact of sampling rate on results from just a single data file that was oversampled (acquired at faster than optimum rate) during method development. You could evaluate resolution and S/N (or LOD) trade-offs as a function of averaging, and then update your method with the optimal rate for subsequent analyses. This is a handy approach to try, if your data analysis package includes post acquisition filtering. The reason I would not recommend relying on post-acquisition data filtering for the actual method (even though it can yield the same results) is that the data file sizes are much larger (Figure 4). Larger data file sizes not only take up more disk space, they slow down data analysis, interactive data review and reporting tasks, so it is best to choose sampling rate correctly in the first place.
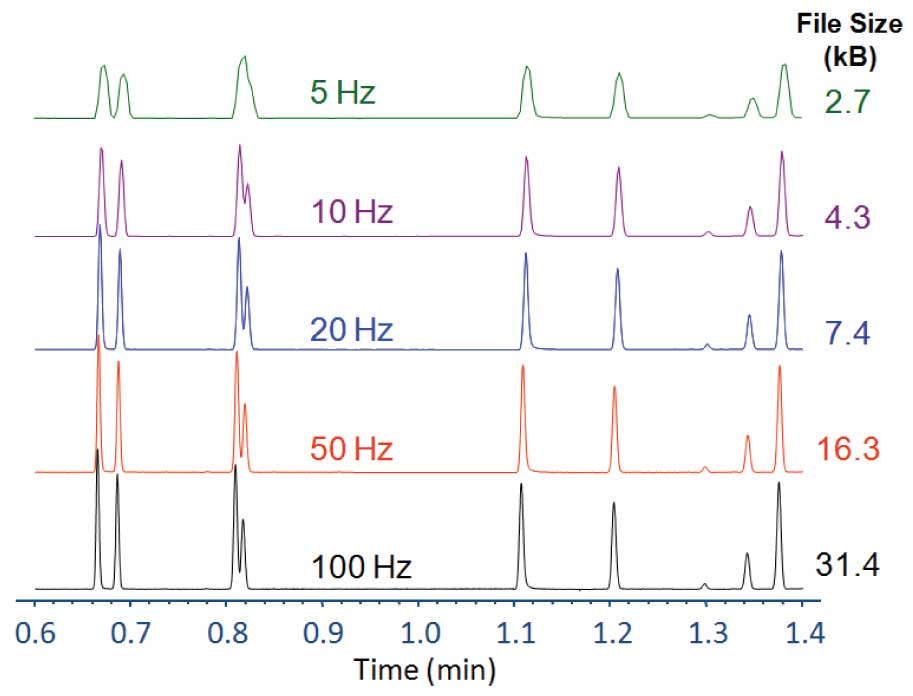
Figure 4: Data rate can affect peak shape and apparent resolution. As sampling rate is reduced (in systems that average data down to achieve the lower rates), apparent peak width broadens, peak height reduces and peaks that were actually resolved chromatographically appear overlapped.
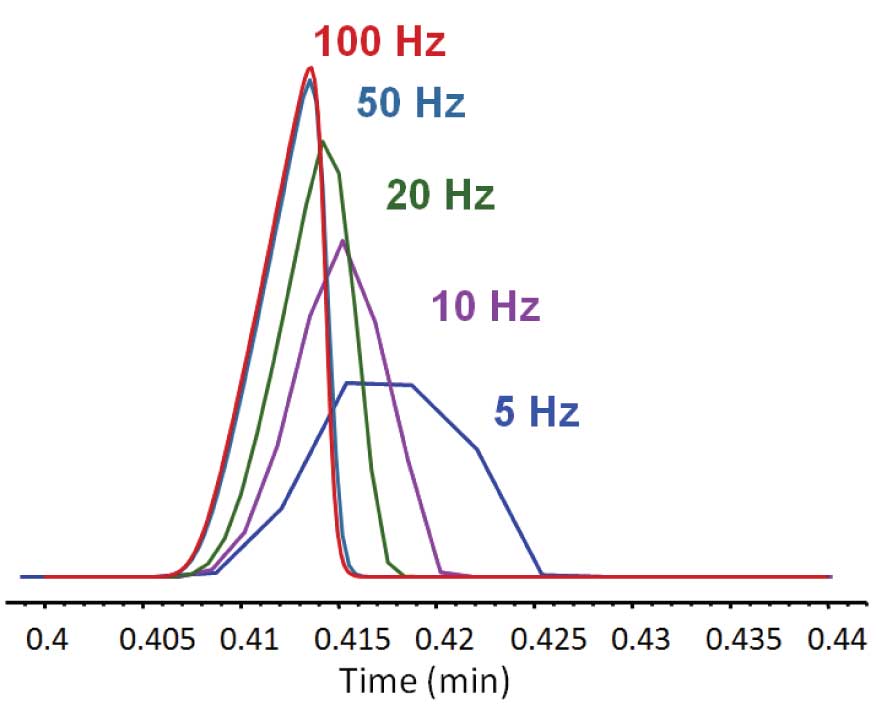
Figure 5: Apparent peak width and height change as a function of detector sampling rate. Peak areas only vary by 3% with continuously integrating or averaging detector electronics. Undersampling also shifts apparent retention time (consistently) and decreases repeatability (if integrator does not do curve fitting) due to lower probability of catching peak maximum.
Optimal sampling rate is quite dependent on the specific instrument and the data system as well as the actual chromatographic peak width. The generally-accepted “safe” practice is to ensure that the chosen acquisition rate yields 10-15 points across the full peak width (5-7 per half width). If the goal is maximum S/N (lowest LOD) and the data are averaged/summed to achieve slower rates, then one operates closer to 5 points across the full peak and trades off a bit with apparent resolution. Default acquisition/sampling rates that are provided by instrument manufacturers (or the guy down the hall) are not necessarily optimal for your specific method, GC system and configuration. It is the responsibility of the method developer to determine the best sampling rate depending on the actual results.
This blog article series is produced in collaboration with Dr Matthew S. Klee, internationally recognized for contributions to the theory and practice of gas chromatography. His experience in chemical, pharmaceutical and instrument companies spans over 30 years. During this time, Dr Klee’s work has focused on elucidation and practical demonstration of the many processes involved with GC analysis, with the ultimate goal of improving the ease of use of GC systems, ruggedness of methods and overall quality of results. If you have any questions about this article send them to techtips@sepscience.com


