For AMDIS to be as effective as possible, it is essential to have high quality target libraries. These can either come from standards taken with the same instrument that the data is analysed on or from the NIST library. In this article the development of libraries from experimental data is discussed.
Building a Library from Standards
For the most part it is better to have a library of spectra taken on the same instrument with retention indices from the same column that will be used for the analysis. It is relatively easy to do this using AMDIS. What follows is a quick summary of the steps — first run an analysis of a set of hydrocarbons that span the data you will want to take. Use this experiment and the hydrocarbon calibration library that comes with the AMDIS package to create a calibration file. Now run your standards. Typically you can run multiple standards in the same run, ideally there should not be strong over lap but there does not have to be great separation, especially if the spectra are distinct (for example as might be expected from a set of pesticide standards). However, if the spectra have strong degrees of similarity, then the number of compounds that can be analysed in a single experiment is limited. When you run this first analysis, any library can be used.
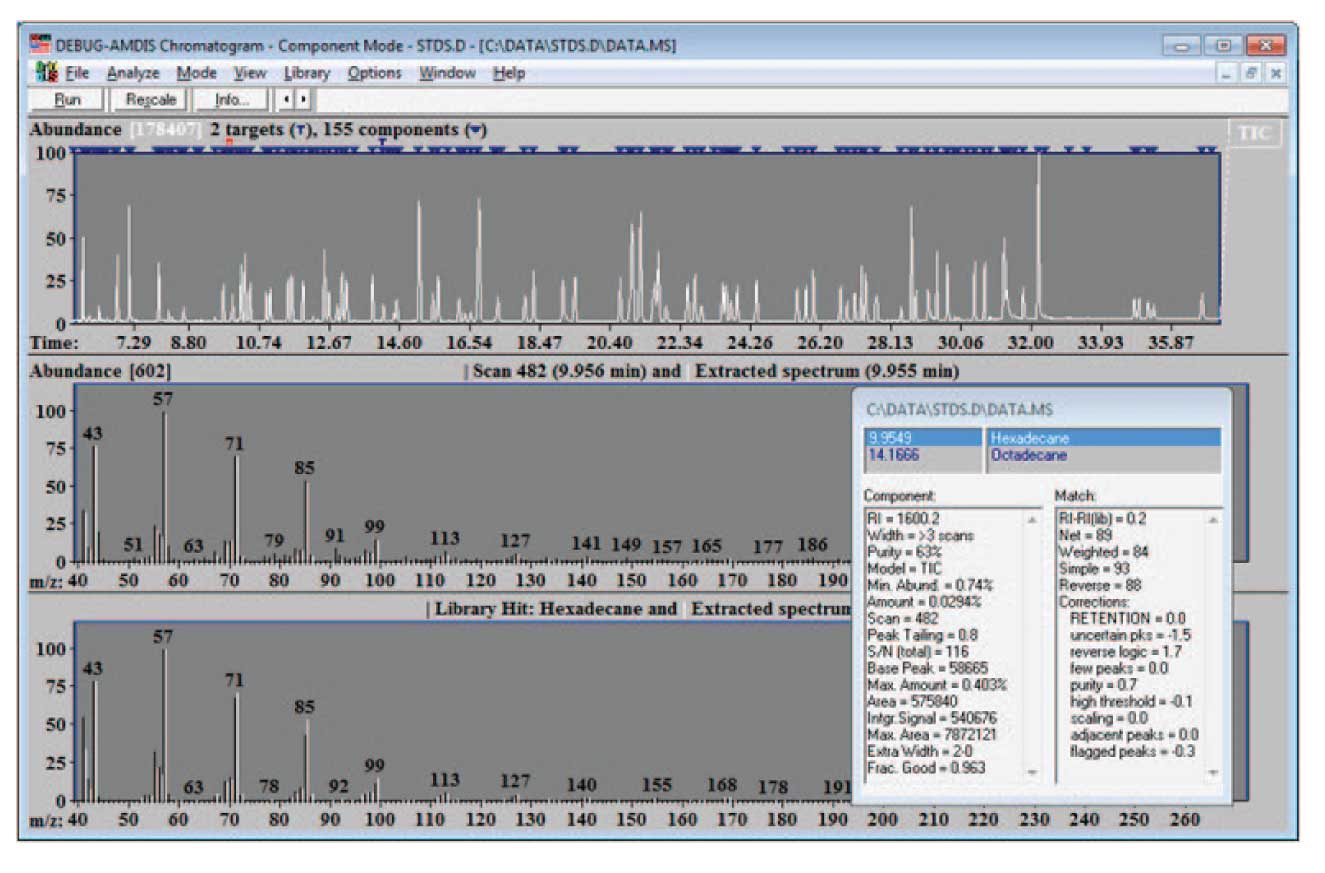
Figure 1: Search Results Using Hydrocarbon Calibration Library.
An example of such a run is shown in Figure 1. Here a simple hydrocarbon library, essentially the same one as used to do the calibration data was used for a target library. Once the analysis has been run, select Analysis/Search NIST Library…, and a screen similar to the one shown in Figure 2 will appear. Typically, for the purpose of building a library for the first time, you will want to search “All components” with the NIST search software; however for later additions to the library once it is largely built, you will search “Only unidentified components”.
In the case shown, a set of pesticide standards have been injected. AMDIS has isolated 155 components (2 of which were identified by the target library of calibration hydrocarbons), and after the identification by NIST, 102 total components are identified. These data can become the basis of a new target library. For building a library, it is important to only select data that are high quality. One important criteria for this quality is the match of the data to the NIST library. Here a minimum match factor of 80 is used and the hits are only reported if the match factor is greater than or equal to 80. In addition, be sure to check “Use instrument m/z limits”, and “Build combined result”. The first forces the NIST search software to use the experimental m/z limits in comparing spectra.
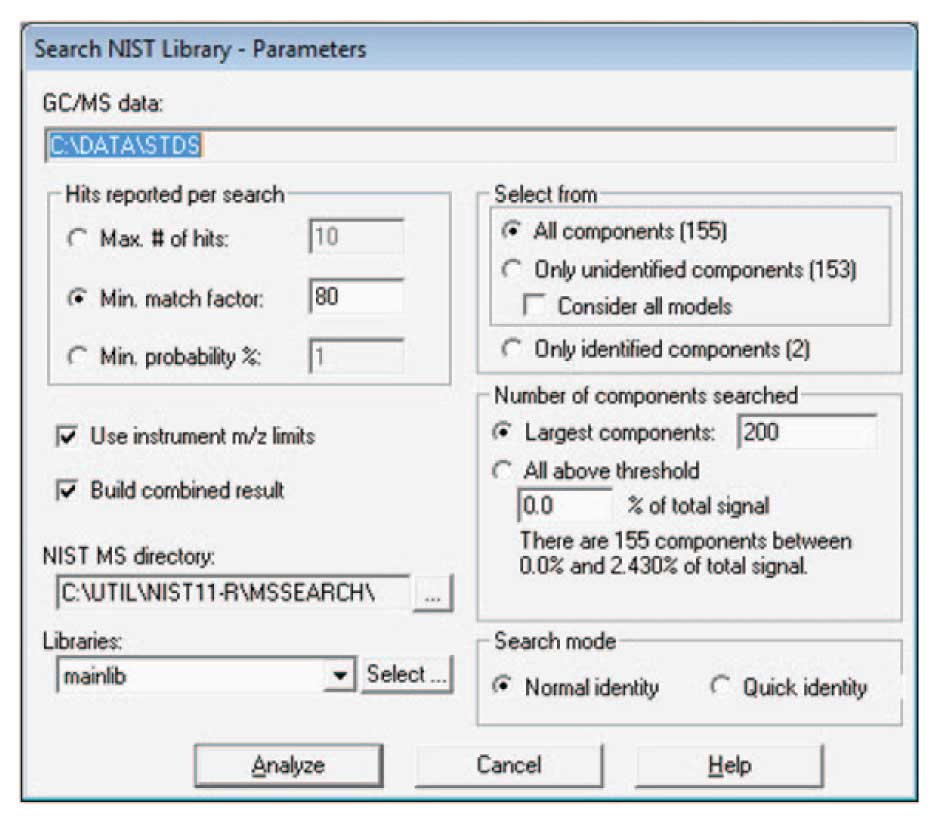
Figure 2: Controls for NIST Library Search of Data.
To add data to a library, select “Library/Build One Library”. From the resulting screen select Files and Create New Library in the next screen. Finally give the new library a name (Stds.msl). The resulting screen will look something like Figure 3.
The details of how the screen will look will depend upon the data that you have active when you chose to add spectra to the library. Note that the data selected has been identified by the NIST search; the library editor has the information about the time and retention information. In this case, when you select “Add…” the program will give you the choice of adding the extracted spectra (the experimental data as deconvoluted by AMDIS) or the NIST spectra. You may choose to use either spectrum — a discussion of which is the best choice is given below. Once the choice is made, a screen similar to Figure 4 will be displayed (the amount and type of data for a spectrum to be displayed is set by the drop down list — highlighted as “Text” in the figure). Notice that the information both from the chromatogram (the RI and RT values) and the data from the NIST program (name, CAS number, formula) and the spectrum which is either taken from the experimental data or the NIST library is combined for the library entry. Note that the data can be displayed as text (as shown in Figure 4) or as a graphical spectrum.
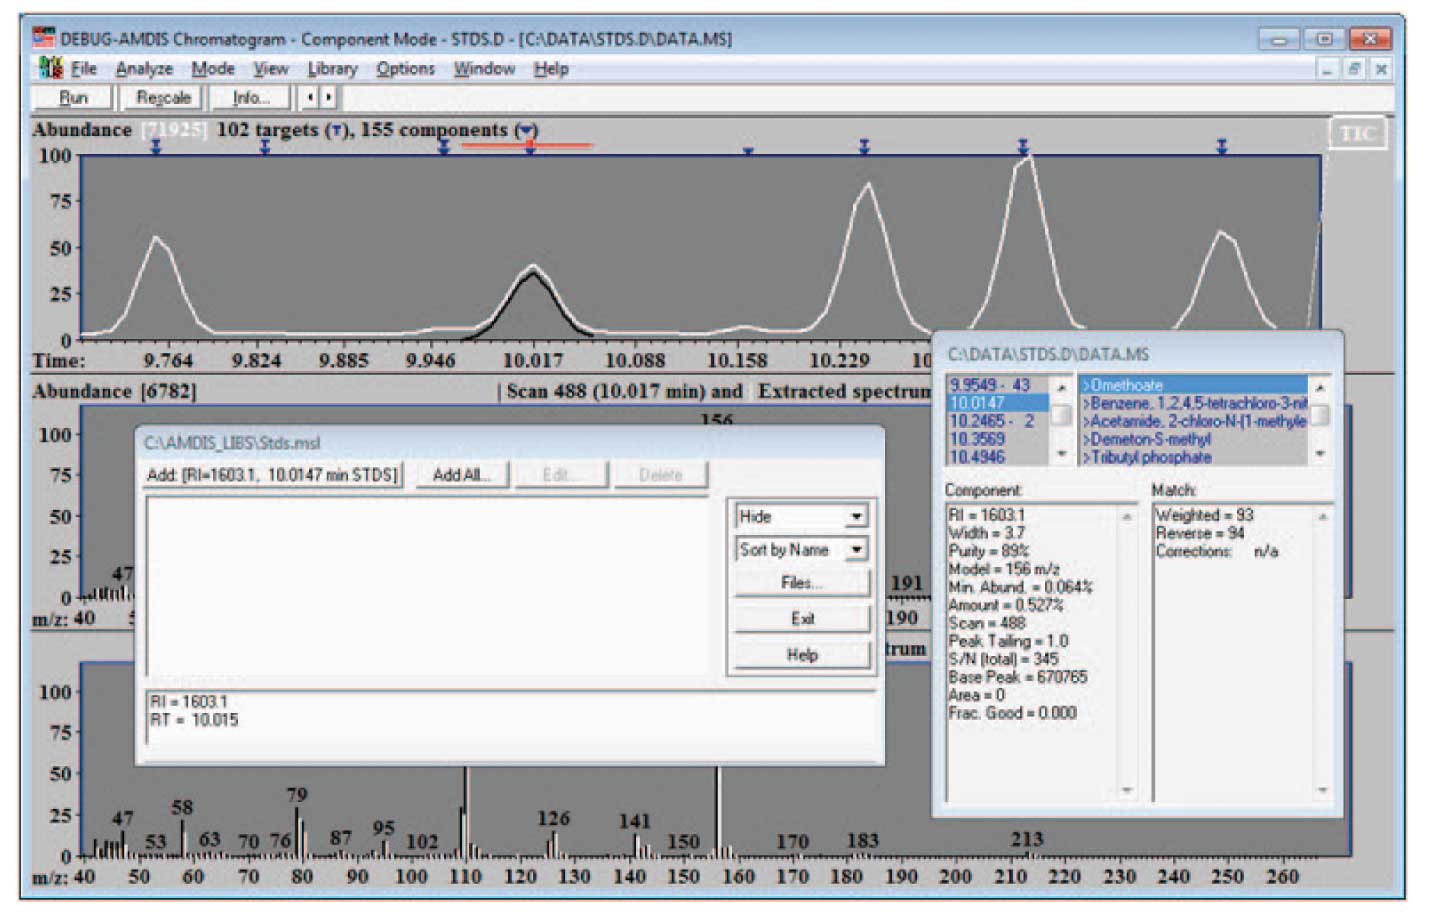
Figure 3: New Library Ready to Add Spectra.
The choice between adding the spectrum from the NIST library and from the experimental data depends on several factors. In general, the sensitivity of the analysis will be improved if the spectra in the library are from the same instrument (or type of instrument) as is used in the analysis. Any tuning biases that exist will be in both the library and the experimental data thus increasing sensitivity. This may be especially true if the experimental data is taken on an instrument that is very different from the data in the NIST library, which is taken on instruments with standard electron impact ionization not ion trap instruments. However, in some cases it may be advantageous to take the NIST spectrum since the experimental spectrum is not of sufficiently high quality. There are three parameters provided by AMDIS that are the most useful in deciding which spectrum to add to the library: these are Minimum Abundance, Purity, and Fraction Good.
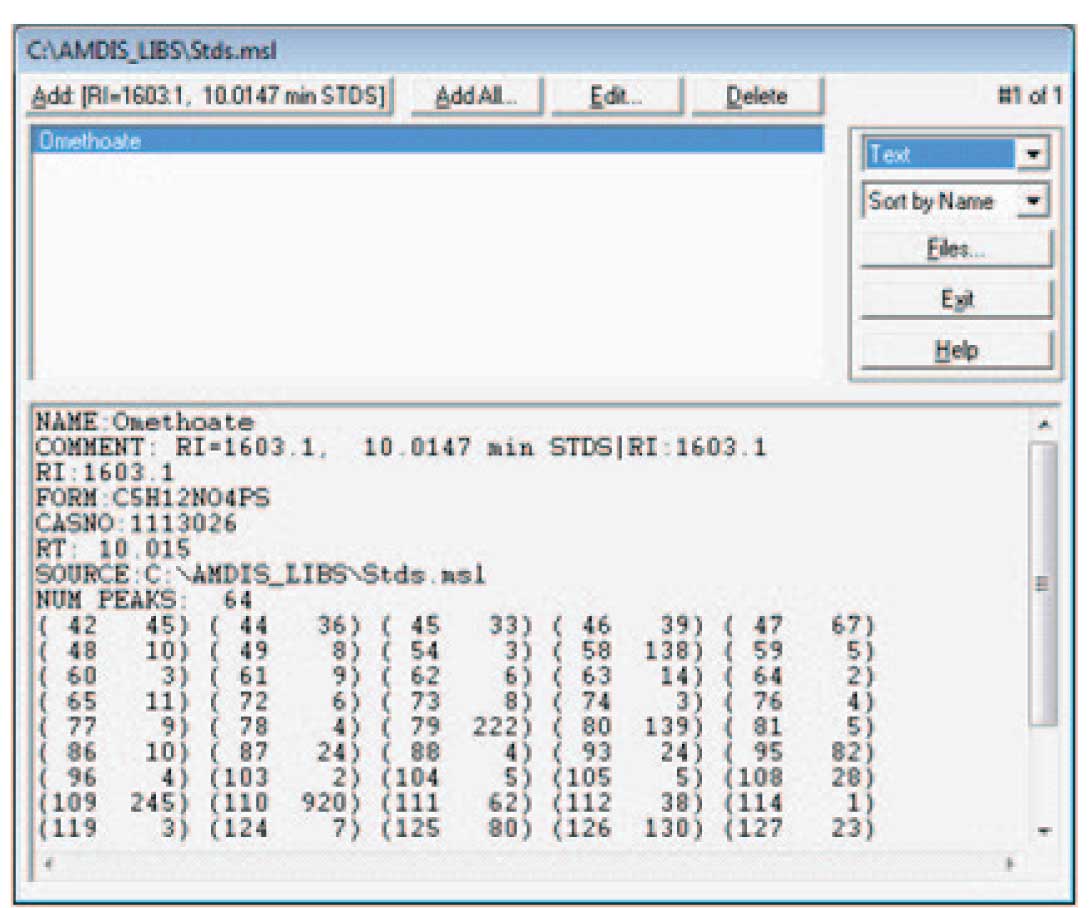
Figure 4: Data from both NIST and AMIDS in Library Entry.
Minimum Abundance refers to the smallest peak, relative to the base peak that AMDIS can extract — this is a statistical parameter and AMDIS will in some cases extract data that is below the minimum abundance. The smaller this value is, the more likely that AMDIS will have extracted all of the small peaks, which may be diagnostic. Ideally the value should be 0.1% or lower. If the value is >0.2% then the NIST library spectrum should be taken.
The second parameter, Purity , measures the fraction of the total experimental ion current at the centre of the extracted component that is accounted for by the extracted component. Even with an isolated peak this may not be 100% since column bleed, tailing of earlier peaks or other factors may contribute to the TIC but not to the component. However, unlike minimum abundance, there is no hard and fast rule for the best value of purity. It is possible to get library quality spectra from peaks with purity as low as 30%, but as a general rule purities of >50% should be preferred.
The last parameter, Fraction Good , is a measure of the level of uncertain peaks in the data. Recall that an uncertain peak is an ion which is not clearly a part of the extracted component. This may be because the intensity of the ion is very small relative to the noise but is most often because the ion has a time profile that differs from that of model peak extracted for the component. If the fraction good is not greater than 0.8 there is a very strong possibility that the data will not be library quality and the NIST spectrum should be selected. Visually high levels of uncertain peaks (low fraction good) can be seen in a large number of dashed peaks in the extracted spectrum. Note, the current version of AMDIS requires that to see the fraction good for a target from the NIST search, you select the component () not the target (T), however when you are using the AMDIS library all of this information is available with the target.
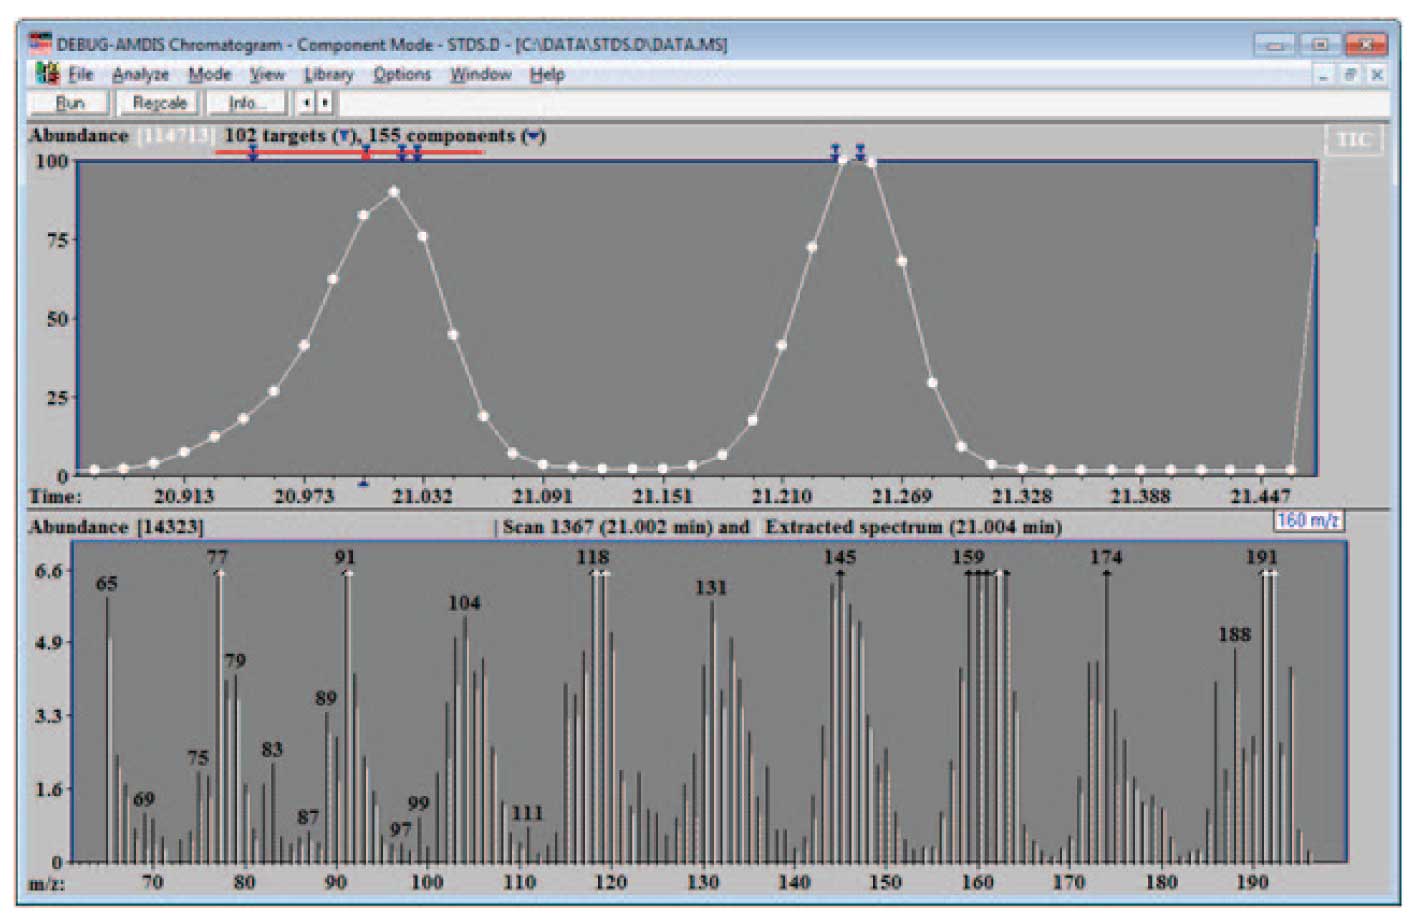
Figure 5: Data for Possible Library Addition.
In the case of the data shown in Figure 3, the fraction good was 0.996, purity 89% and minimum abundance 0.06, so the data is clearly of a very high quality and can be placed in the library. The example shown in Figure 5 illustrates a case where the spectra from the data may not be optimal. In the specific example shown at 21.004 min, the purity is 57%, the minimum abundance is 0.03, and the fraction good is 0.86. Note in the lower part of the figure the relatively large number of uncertain peaks (dashed lines) in the expanded data. In addition the match factor to the NIST spectrum is only 86 out of 100. In this case it would probably be better to take the NIST data for the library or to work with a less complex mixture. However, in some cases, particularly if the compound is not in the NIST library and the data cannot be taken from a clean spectrum, data of the quality of the spectrum above can be useful but not optimal.
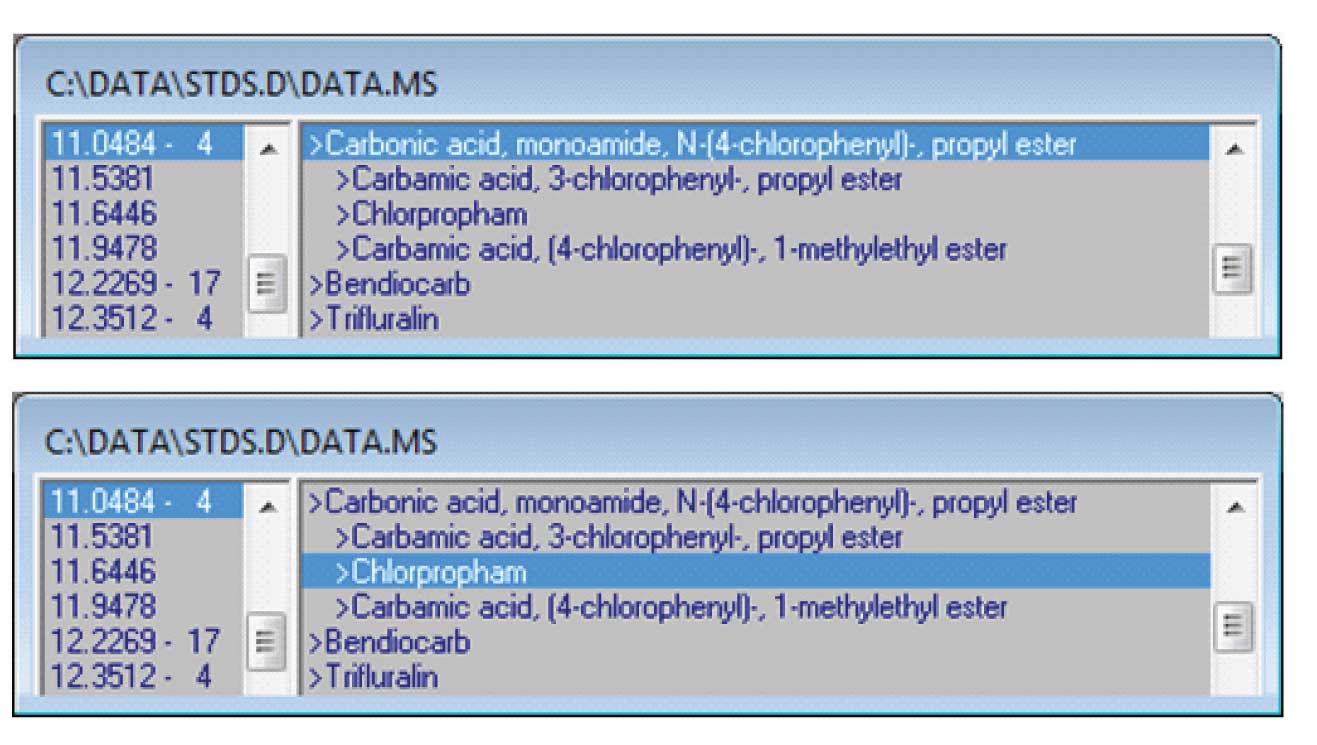
Figure 6: Selecting the Correct Compound.
Finally, it is important to check the results. The NIST database has a very large number of compounds, some of which may be spectrally similar to the standard. In the case shown in Figure 6 — top, the number of hits that have a match factor greater than the number specified when the search was done (80 in this case) is displayed next to the retention time. In this case all four hits had match factors between 85 and 89. The best hit from the NIST database was not the standard spiked into the mixture but an isomer. The correct hit was the third compound in the list. If this happens, the automatic library building can still be used but the correct hit must be selected from the list — Figure 6 — bottom. When this hit is selected and the “Library/Build One Library” menu is selected, the data that will be used from the NIST library will be that from the third hit so that the correct formula, CAS number and name will be added.
Using a set of standards to build a library with AMDIS can be very efficient. Because of the ability of AMDIS to deconvolute complex mixtures, more standards can be added in a single experiment, and the addition of data using both AMDIS and the NIST database is very efficient.
In a case such as that illustrated here, a complete library can be assembled for over 100 standards with retention indices, formula and names in about one hour.
In the next section of this series, building libraries with the NIST but without standards will be discussed.
A demo version with a limited library of the NIST MS Search Program may be downloaded. Click here>>
AMDIS may also be downloaded by itself. Click here>>
Gary Mallard was at NIST for 31 years and for the last 10 was Group Leader of the Standard Reference Data Group which was responsible for the NIST MS Database and the NIST WebBook. At NIST he was active in both writing the help files and part of the quality control for AMDIS. After leaving NIST he was Head of Laboratory for the Organization for the Prohibition of Chemical Weapons (OPCW) for 3 and a half years. He has developed a number of courses on AMDIS for training at the OPCW and continues to teach new inspectors for the Organization. He has also given AMDIS courses for instrument companies, the FDA, the CDC and at a number of laboratories in Europe, China and the United States. He is currently working on using AMDIS to develop databases of unidentified compounds in common matrices and improvements in the AMDIS software under a contract with NIST.
O. David Sparkman is currently an Adjunct Professor of Chemistry at the University of the Pacific in Stockton, California; Contractor to the National Institute of Standards and Technology Mass Spectrometry Data Center; President of ChemUserWorld.com; and a former American Chemical Society Instructor (1978–2006) and American Society for Mass Spectrometry Member-at-large for Education (2004–2006).
At the University of the Pacific, Prof. Sparkman teaches courses in mass spectrometry and analytical chemistry and manages the mass spectrometry facility. Over the past 28 years, he has developed and taught five different ACS courses in mass spectrometry; he holds positions on the Editorial Advisory Boards of the European Journal of Mass Spectrometry and the HD Science GC/MS Update – Part B; and is the Book Review Editor for the European Journal of Mass Spectrometry. He is the author of Mass Spectrometry Desk Reference (Global View Publishing: Pittsburgh, PA, 1st ed. 2000; 2nd ed. 2006). Prof. Sparkman is a member of the Editorial Boards of the John Wiley Encyclopedia of Environmental Analysis and Remediation and Encyclopedia of Analytical Chemistry, Editor of and a contributor to the Mass Spectrometry Section of the Encyclopedia of Analytical Chemistry, and a contributor to the Encyclopedia of Environmental Analysis and Remediation. Along with J. Throck Watson, he developed the Mass Spectral Interpretation Quick Reference Guide.
He also provides general consulting service in mass spectrometry for a number of instrument manufacturers, manufacturing companies, and government agencies.


