In the first two parts of the discussion of setting up AMDIS the basics of running an analysis with retention index filtering as well as a simple analysis were discussed. In this final part of the set up section, instrument settings and filtering will be covered.
Instrument Settings
It is possible for AMDIS to distinguish between two components that are as close as a half scan apart. To do that it is essential that the signal that is recorded by the instrument as being at a specific time, is converted to the true signal vs time for each ion trace. This process, called deskewing, was discussed in the first of this series. As a general rule instruments can be broken into scanning and non-scanning instruments. The non-scanning instruments do not have a systematic time bias for the data — these include time of flight and ion trap instruments. However, all quadrupole and magnetic sector instruments must have deskewing done for optimal results. Failure to allow for this can reduce the ability of AMDIS to extract very closely eluting components.

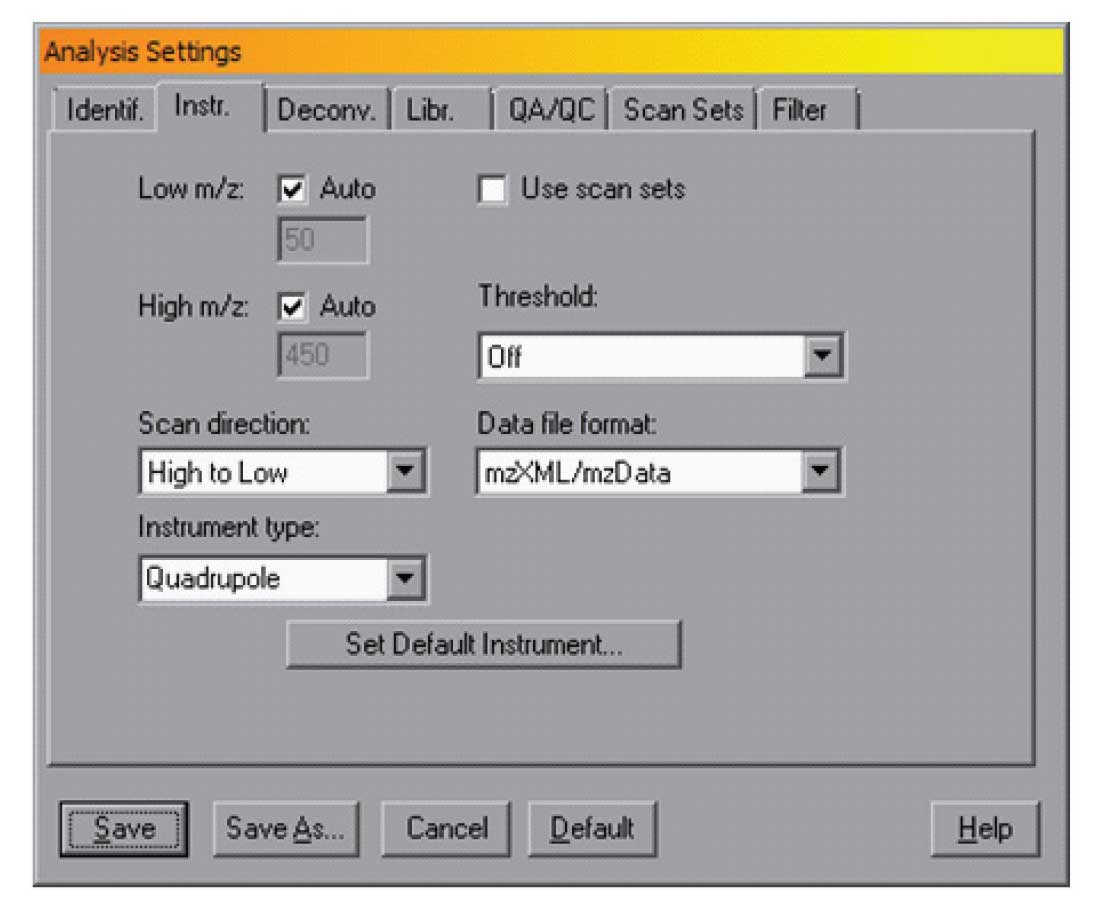
Figure 1: Instrument and data format.
The rate of skewing is different for magnetic sector and quadrupole instruments and the direction of scan varies from instrument to instrument. For the most part all Agilent instruments scan from high mass to low mass — that is each scan starts at the highest mass for the scan and goes to the lowest. Most other instruments scan from low to high mass. Generally, when you select the instrument data file format the proper scan direction is set. However, for certain standard types of data files that are generated by many instruments, it is essential to set the scan direction. These types include the ANDI (or netCDF) format and the new mzXML format. Both of these formats are common export formats for many instruments and the selection of the scan direction is important.
In AMDIS, you can set the standard format for your instrument in the dialogue box opened from the Analyse/Settings selection on the menu bar. The file format for the data is set in the “Instr.” dialog as shown in Figure 1.
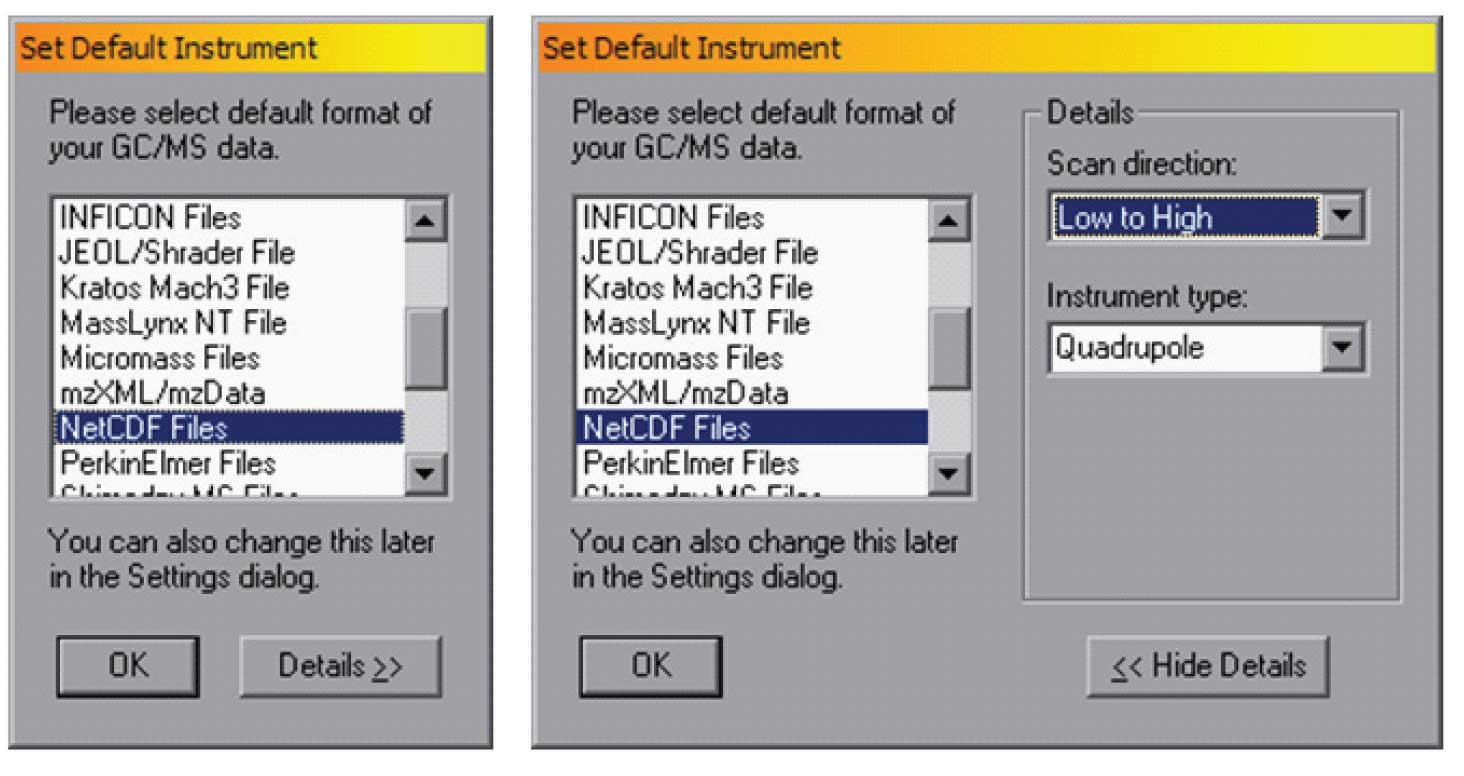
In the figure the mzXML/mzData format is selected, and in this case the scan direction is high to low. Note that these parameters can be changed for a single analysis or they can be set as defaults. To set the default instrument — for example if you have an instrument that produces netCDF data files and scans from low to high, you can use the “Set Default Instrument” , and specify “Details>>” as shown in Figure 2.

Figure 2: Set default Instrument (on left), Details (on right) — setting the instrument type.
Once the file type and scan direction has been set, the program will remember them for future uses. Note that for most file/instrument combinations the correct scan direction is built into AMDIS. However, some instrument companies use a common file type for multiple instruments and it is essential to select the specific scan direction that the instrument uses.
Referring back to Figure 1, note that there is a low m/z and a high m/z setting. Normally AMDIS will use the noise in the data file to select these. However, if you have an unusually clean system, it is possible that the high mass may not be correctly set, thus making the deskewing not as accurate as it should be. After AMDIS has analysed a data file, it will report in Info/QA/QC what the scan direction as the highest mass detected was. If the value that AMDIS uses for the analysis does not correspond to the scan range used, then the “Auto” check box shown in Figure 1 must be unchecked and the actual low and high masses used in the experiment entered — note that if your experiments always use the same range, these values may be entered. Typically this is not needed but the first time that AMDIS is used on a new or a newly cleaned instrument, these values should be checked. The special case where the scan range is changed over the course of the chromatogram is coved below.

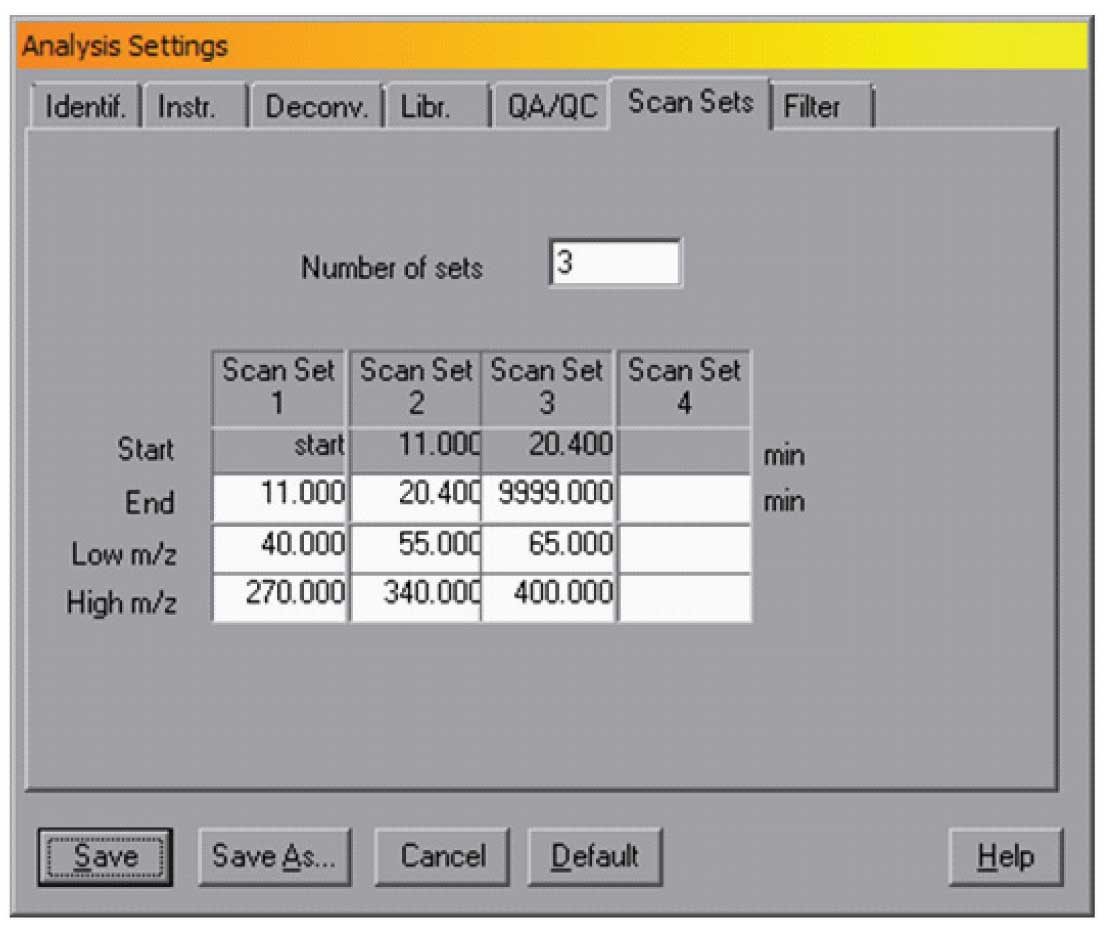
Figure 3: Scan settings
There are two other check boxes in this window — Use Scan Sets and Threshold. The Use Scan Sets selection tells AMDIS that the maximum and minimum masses changed over time. This is typical for some pesticide analysis where the mass scan range is changed over the chromatographic run. In this case the Analysis/Settings/Scan Sets dialogue should be set to correspond to the experimental conditions. A typical example is shown in Figure 3.
In this case the data is taken from the start of the run until 11 min over a mass range of m/z 40 to 270, then from 11 to 20.4 min over a mass range of 55 to 340 and finally from 20.4 to the end over a mass range of 65 to 400. Note, the end points of each time range are all that needs to be specified as the start will automatically be set to the end of the previous time. Without this setting, AMDIS would have assumed that the scan range was 40 (the lowest mass) to 400 (the highest) over the entire chromatographic run. By setting scan sets, if used, AMDIS can deskew more accurately and thus provide better resolution of the peaks. NOTE: It is essential to check “Use Scan Sets” in the dialogue shown in Figure 1 and to set the proper values in the Scan Sets dialogue. The data in the Scan Sets dialogue is not used if the check box in the Instr. dialogue is not set.
The last item in the dialogue is the “Threshold” setting, which can, in some cases be useful in instruments that do not do hardware thresholding. In general it is not needed but the level can be set (high, medium or low) and for very noisy data, it may be useful. In all cases all of the settings are saved and will do so automatically.

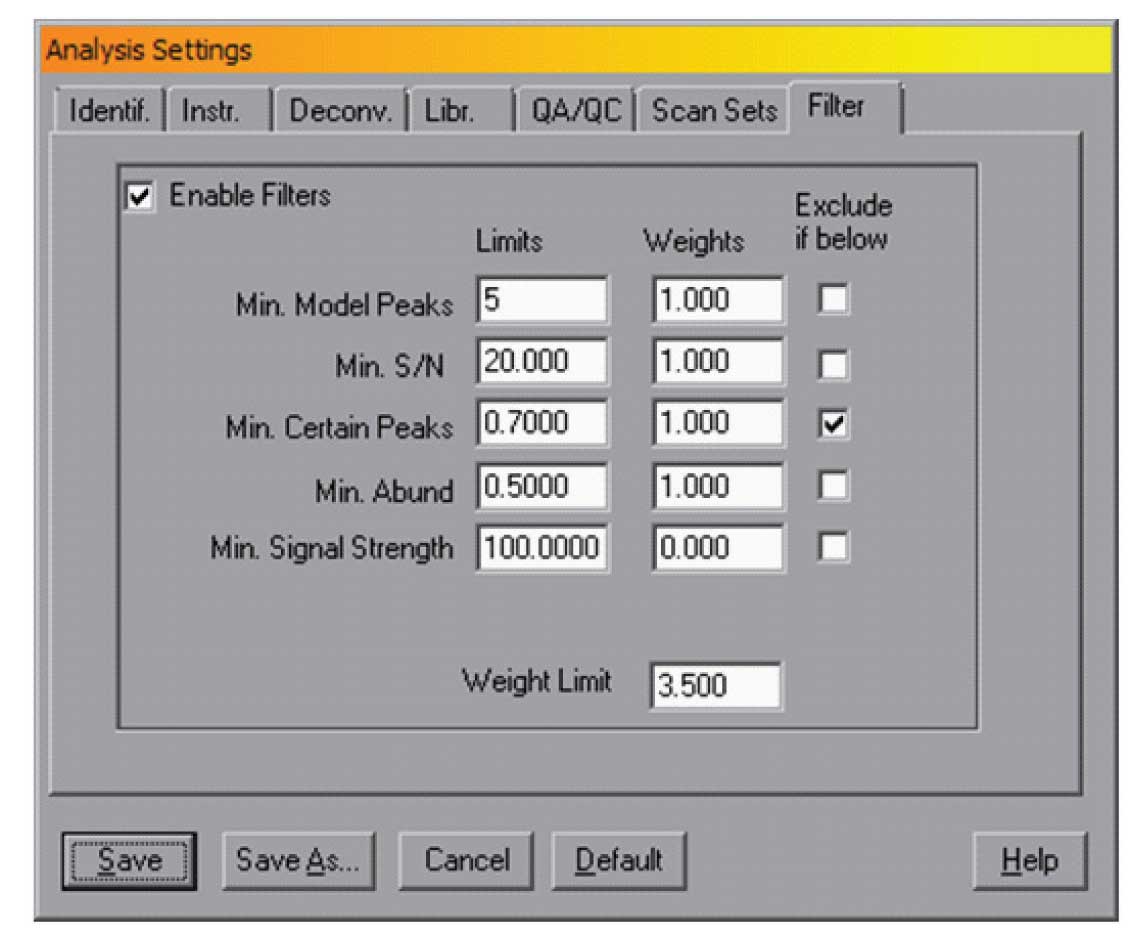
Figure 4: Filter control.
Filtering
For very complex data files, the number of small peaks can be high and for some applications these are not necessary. It is possible to use the deconvolution parameters (i.e., lowering sensitivity) to reduce the number of peaks but there is a risk of losing some small target compounds. The current version of AMIDS (version 2.71 – June 2012 release) contains a filtering mechanism that will allow better control over the non-target components that AMDIS reports. The tabbed dialogue “Filter” in the Analysis Settings dialogue provides control of this filtering. The dialog is shown in Figure 4.
The filter controls set which unidentified components will be shown. The identification is done exactly as always, the filtering has no effect on what targets are found by AMDIS. The filtering does change what is displayed since components that have not been identified and do not meet the filter criteria are omitted.
The filters are designed to use parameters that are typically associated with high quality components rather than noise or very poorly defined components. The parameters that can be used to filter the data are
- The number of model peaks — typically a component with 5 or more peaks that can be used as a model is a better defined component.
- The signal-to-noise (S/N) ratio of the component — again larger values are associated with better defined components.
- Fraction of certain peaks — an ion that is difficult to deconvoluted, either because it is too low or cannot be assigned to the deconvoluted component because of interference is marked as uncertain. As the fraction of the total deconvoluted ion current that is uncertain increases for any given component the confidence in the component is reduced.
- Minimum abundance is the smallest peak (relative to the base peak) that can be statistically abstracted based on the noise. This parameter is expressed as a fraction of the base peak and the lower the better. Typically a value of 1 (i.e., 1% of the base peak) is good.
- Minimum signal strength — if there is a level below which the data should be viewed as suspect, this parameter can be used. NOTE unlike the first 4, this value is instrument dependent.
In all cases a value can be set for these and if the parameter does not meet that value, the component can be omitted. To use this feature the “Exclude if below” box should be checked. In the example in Figure 4, any component with uncertain peak levels above 30% (i.e., certain peak levels below 70%) will be rejected.
It is also possible to use these parameters as filters. In this case a weight is assigned to each parameter and if the parameter meets the criteria that weight is given to the component. In this case a total weight must be assigned (Weight Limit) and any component that does not get at least that weight is omitted. Values worse than the limit give some weight to the sum (for example if the number of model peaks in the figure above was 3, the weight from the model peak would be 3/5 of 1 or 0.6). In addition, values better than the limit contribute slightly more to the total weight.
The use of filters can be very helpful, especially if there are large numbers of unidentified peaks and these are to be further processed. Using the filters noted above, a complex essential oil sample, with 93 target compounds identified, had a total of339 components. Without the filters, there were 688 components and as noted the same 93 targets.
The filters allow a degree of control over the output that may be very useful in the analysis of complex data files, especially when there are large numbers of unknown components. The filters insure that only the best defined components are selected for any further analysis.
The specific filter parameters that make sense for any given application will vary a great deal. If the goal is to only have well defined components that are likely to be pure compounds then the filters may need to be set to more critical levels. The values shown above have been tested extensively in the analysis of derivatized urine and plasma samples as well as a wide variety of essential oils and found to be a reasonable set. However, the filtering will need to be tailored for each experiment where it is needed. Note that for many applications of AMDIS, where only target data is sought, the filtering is not needed. The use of AMDIS for metabolic experiments where there are very few target compounds has prompted the addition of filtering to the program.
This concludes the discussion of using AMDIS in normal analysis. In the next part of this series the use of AMDIS both alone and in conjunction with the NIST database to build libraries for analysis will be covered.
A demo version with a limited library of the NIST MS Search Program may be downloaded. Click here >>
AMDIS may also be downloaded by itself. Click here >>
Gary Mallard was at NIST for 31 years and for the last 10 was Group Leader of the Standard Reference Data Group which was responsible for the NIST MS Database and the NIST WebBook. At NIST he was active in both writing the help files and part of the quality control for AMDIS. After leaving NIST he was Head of Laboratory for the Organization for the Prohibition of Chemical Weapons (OPCW) for 3 and a half years. He has developed a number of courses on AMDIS for training at the OPCW and continues to teach new inspectors for the Organization. He has also given AMDIS courses for instrument companies, the FDA, the CDC and at a number of laboratories in Europe, China and the United States. He is currently working on using AMDIS to develop databases of unidentified compounds in common matrices and improvements in the AMDIS software under a contract with NIST.
O. David Sparkman is currently an Adjunct Professor of Chemistry at the University of the Pacific in Stockton, California; Contractor to the National Institute of Standards and Technology Mass Spectrometry Data Center; President of ChemUserWorld.com; and a former American Chemical Society Instructor (1978–2006) and American Society for Mass Spectrometry Member-at-large for Education (2004–2006).
At the University of the Pacific, Prof. Sparkman teaches courses in mass spectrometry and analytical chemistry and manages the mass spectrometry facility. Over the past 28 years, he has developed and taught five different ACS courses in mass spectrometry; he holds positions on the Editorial Advisory Boards of the European Journal of Mass Spectrometry and the HD Science GC/MS Update – Part B; and is the Book Review Editor for the European Journal of Mass Spectrometry. He is the author of Mass Spectrometry Desk Reference (Global View Publishing: Pittsburgh, PA, 1st ed. 2000; 2nd ed. 2006). Prof. Sparkman is a member of the Editorial Boards of the John Wiley Encyclopedia of Environmental Analysis and Remediation and Encyclopedia of Analytical Chemistry, Editor of and a contributor to the Mass Spectrometry Section of the Encyclopedia of Analytical Chemistry, and a contributor to the Encyclopedia of Environmental Analysis and Remediation. Along with J. Throck Watson, he developed the Mass Spectral Interpretation Quick Reference Guide.
He also provides general consulting service in mass spectrometry for a number of instrument manufacturers, manufacturing companies, and government agencies.


