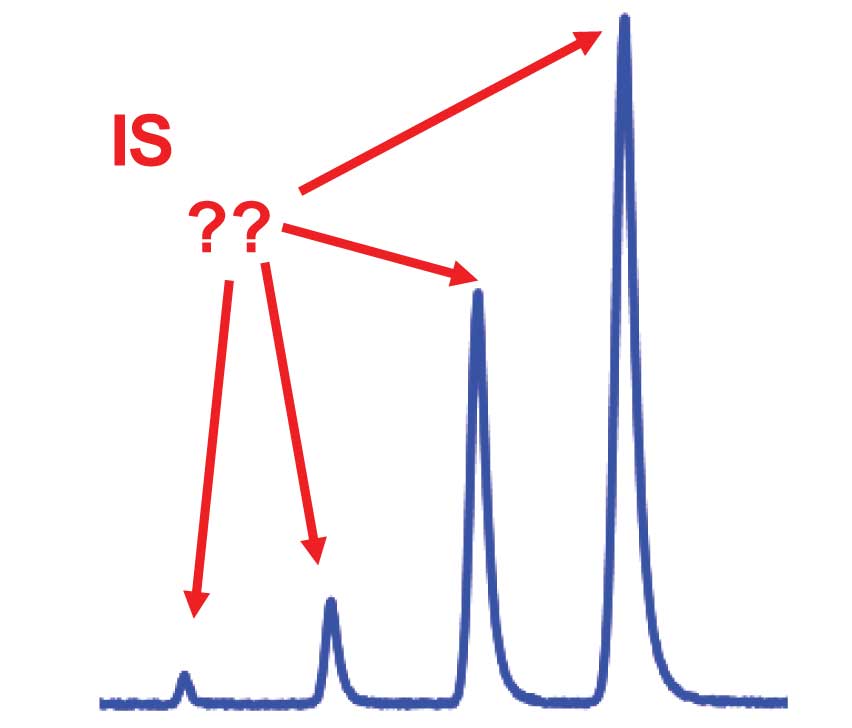
I recently had a reader ask me a question about what size the internal standard (IS) peak should be for a bioanalytical method (drugs in plasma). He was torn between advice that the IS should be about the same size as the smallest peak of interest, at the lower limit of quantification (LLOQ) and that it should be near the middle of the calibration curve. And if near the middle of the calibration curve, how is this determined with a method that has standards injected at concentrations of 1, 2, 5, 10, 20, 50, 100, 500, and 1000 ng/mL?
First, we should look at the regulatory issues. When LC-MS (or LC-MS/MS) is used, the IS often is a stable-labelled, or isotopically labeled, version of the analyte, with several 13C or 2H substitutions. It is rare that a stable-labelled compound is 100% pure; rather it contains some unlabelled analyte, and you don’t want to mistakenly quantify this contaminant and attribute it to analyte from the sample. For this reason, the IS peak cannot have more than 5% of the unlabelled analyte present.
 Figure 1
Another issue with stable-labelled IS is that these compounds often co-elute with the analyte of interest. If this is the case, the time spent in detection (“counting” ) of the IS peak is time not spent counting the analyte. For example, if the peaks are of equal size, you might count the IS half the time and the analyte half the time to maximize the area of both. In this case, the analyte peak would be 50% smaller, in terms of area counts, than if the IS wasn’t present (or wasn’t counted). One way around this is to use a bigger IS peak.
For example, if the IS peak were 10 times as large, you would have to spend only 10% of the time counting the IS peak and 90% on the analyte, improving the analyte signal, yet maintaining sufficient IS signal. In this case, the larger the IS peak, the better, but too big and we run into the unlabeled contaminant problem discussed above. Of course, if the IS is chromatographically separated, split counting time is of no concern, but unlabeled contaminants still may be a problem.
There is an additional argument for not having the IS peak too small. This has to do with method error or imprecision. As with most other errors in the chromatographic process, errors in peak measurement add into the total as the square root of the sum of squares:
ET = (E12 + E22 + … + ES/N2 + En2)0.5 (1)
where each of the errors, En, is one contribution, such as sample preparation, injection, integration, and so forth. The contribution of the peak size to this total can be estimated from the signal-to-noise ratio (read more about this in HPLC Solutions #4). The contribution of signal-to-noise (S/N), ES/N, is estimated as
ES/N ≈ 50 / (S/N) (2)
For example, if S/N = 10, ES/N = 5%. Another rule of thumb is that to have minimal contribution to the overall error, an individual error should be no more than half the overall error. Bioanalytical methods are allowed an overall error of ±20% at the LLOQ and ±15% at any higher concentration. We would rather not validate the method close to these limits, so a target of half of this would be reasonable, or imprecision at the LLOQ of ±10% or less. If this were the case, it would mean that ES/N ≤5% is desired. And why push the limits by having S/N = 10 for the IS when there is no reason we should not use a larger peak? When S/N > 50-100, this contribution to the overall method imprecision is negligible. Now we have a good argument not to have the IS peak of similar size to the LLOQ of the analyte.
MS detectors often have a linear range of 10-100-fold, and although it is easy to construct calibration curves with a 1000-fold range, we’ll get the best performance of the detector mid-range. Similarly, a UV detector usually works best with sufficient signal to minimize noise (for example, >0.1AU) and not too close to the upper limit of the range. I don’t like to use a UV detector with signals >1 AU, unless I have to. So a mid-range signal for UV is a good choice, too. Similar conclusions are likely with most other detectors.
With all these various boundaries on the IS signal, you can see that a mid-range IS peak is a pretty good choice. Exactly where this is located is somewhat arbitrary, especially with an exponentially rising calibration curve (1, 2, 5, 10…). In the present case, I would probably choose something in the 50-200 ng/mL range, as long as the signal was within the limits discussed above.
This blog article series is produced in collaboration with John Dolan, best known as one of the world’s foremost HPLC troubleshooting authorities. He is also known for his research with Lloyd Snyder, which resulted in more than 100 technical publications and three books. If you have any questions about this article send them to TechTips@sepscience.com


