In this article the selection of appropriate robustness factors and factor levels relating to the mobile phase will be discussed and in particular, the volume fraction of the organic solvent in the mobile phase for reversed phase HPLC.

Composition of the Mobile Phase
During the development of HPLC methods the composition of the mobile phase is modified to separate and control the retention times of the peaks of interest. In the case of reversed phase HPLC the volume fraction of the organic solvent in the mobile phase is related to the retention factor; increasing the proportion of organic solvent has the effect of decreasing the retention time. The ‘rule of 3’ (which applies to low molecular weight molecules analysed by reversed phase HPLC) allows for an approximate prediction of the effect of changes in the proportion of organic solvent in the mobile phase. A change of 10% in the organic solvent content results in the retention time changing by a factor of approximately 3. The implication of this for robustness testing is that composition of the mobile phase is a very important factor which should therefore be included in the study.
Robustness Factors
The robustness factor to be investigated for isocratic separations is the volume fraction of the organic solvent in the mobile phase. This can be expressed simply as %B. For gradient methods, the method parameter which is analogous to %B in isocratic mode is that of gradient time, or tG, and thus may be selected as a robustness factor. However, this parameter will not be subject to variation when the method is in routine use. An alternative approach for gradient methods is to choose two factors for investigation which will be subject to variation, namely the volume fraction of the organic solvent in the mobile phase at the start and at the end of the gradient. These may be referred to as %BSTART and %BEND.

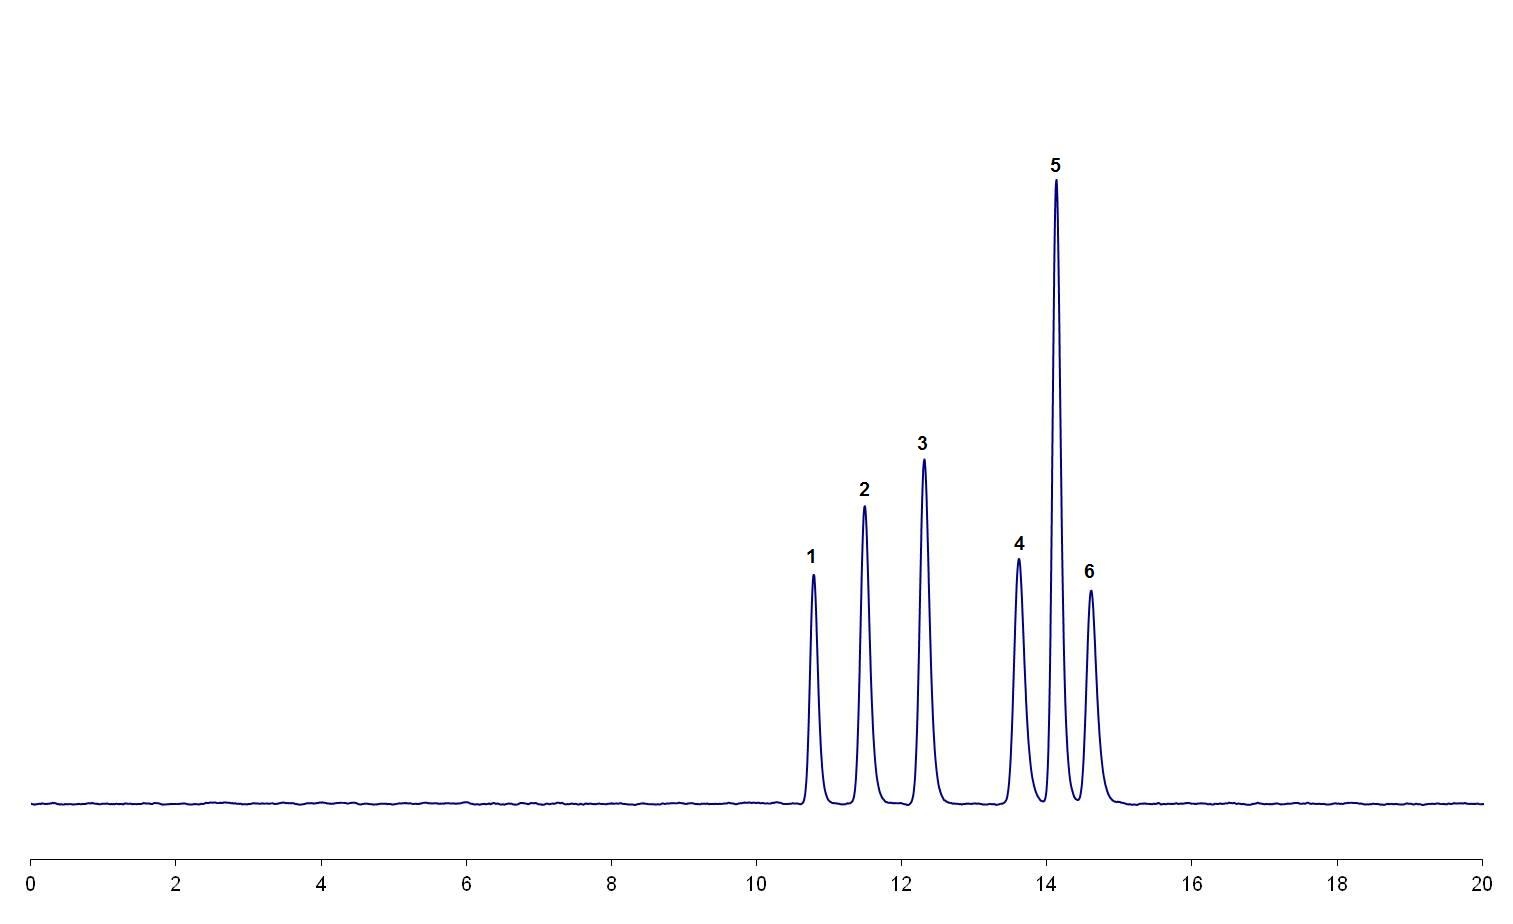
Figure 1: (a) The critical pair (peak 4 and peak 5) in this separation are only just baseline resolved.
Resolution of the Critical Pair
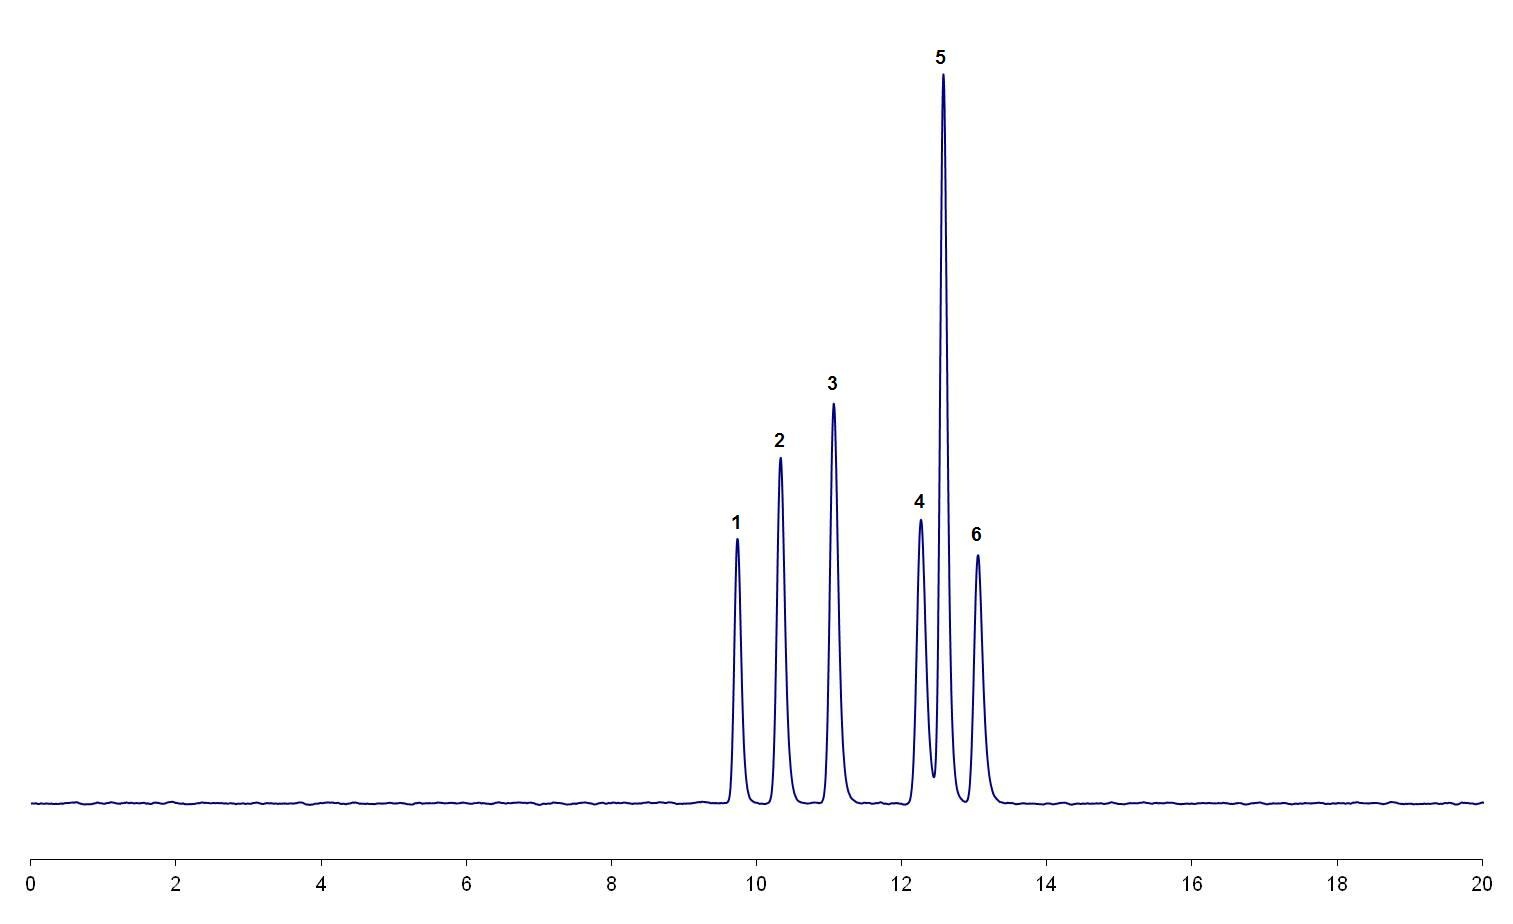
The magnitude of the effect of this factor is dependent on the resolution of the critical pair in the separation. If the resolution is low; e.g., only just baseline resolved [refer to the illustrative example in Figure 1(a)], then it is likely that small increases in the organic content of the mobile phase could result in a loss of resolution and possible co-elution of the critical pair [refer to the illustrative example in Figure 1(b)]. If the critical pair is well separated then it is likely that the separation will be more robust to changes in the amount of organic solvent in the mobile phase.

Figure 1: (b) The critical pair (peak 4 and peak 5) are no longer resolved because of an increase in %B.
Selecting Factor Levels
Having selected the composition of the mobile phase as a robustness factor, the next step is to select appropriate factor levels. This is usually expressed as an interval between the extremes which represent the potential variability when the method is in routine use. In this case the factor levels will consist of a range above and below the percentage of organic solvent (%B) which is written in the HPLC method. The potential variability depends on the errors which may occur during measurement of the volume whilst preparing the mobile phase.
Estimation of Potential Variation of %B
An approximation of the worst case scenario for the error is estimated as follows: The volumes required for mobile phase typically require the use of a 1000 mL measuring cylinder which has a tolerance of ±2.5 mL at a specified temperature. The gradations in the cylinder are typically 2 mL and so a worst case error measurement may be as much as 4.5 mL. The smallest amount that this measuring cylinder is likely to be used to measure is 550 mL, this equates to a maximum error in volume of about 0.8%. If this error is carried through to the overall volume fraction of the organic solvent in mobile phase then a variation of 1% would seem to represent the maximum variability likely to occur, it appears unlikely that normal variation in preparation of mobile phase would exceed this amount. Thus the interval for the factor levels in the robustness study would be %B ±1%. This interval may also be applied to %BSTART and %BEND for gradient methods. Illustrative examples are shown in Table 1 and Table 2 for an isocratic method and a gradient method respectively.

Table 1: Example of factor levels for the volume fraction of the organic solvent in the mobile phase (%B). The mobile phase for the example method is A: 75% Water & B: 25% Methanol.
It is assumed that the laboratory has standard operating procedures in place that ensure that the mobile phase is always prepared in the same way. Typically, the procedure is summarized as follows: The volume of the aqueous portion of the mobile phase is measured and any buffers are added, then the pH is adjusted as required. The organic solvent is measured in a separate measuring cylinder and the two portions are mixed together thoroughly before being placed on the HPLC system.
 Table 2: Example of factor levels for the volume fraction of the organic solvent in the mobile phase at the start (%BSTART) and at the end (%BEND) of the gradient. The mobile phase for the example method is A: 90% phosphate buffer at pH 2.1 & BSTART: 10% Acetonitrile, changing to A: 60% phosphate buffer at pH 2.1 & BEND: 40% Acetonitrile over 20 minutes.
Online Mixing of The Mobile Phase
If the HPLC system is used to mix the mobile phase online, using separate vessels containing the components of the mobile phase, then the error is likely to be very much lower. However, it is beneficial to have robustness data relating to premixed mobile phase to allow maximum flexibility when operating the method routinely.
Capability of The Method
The variation of %B ±1% should provide a reasonable indication of potential variability of the method in routine use. If the full method capability is the aim of the investigation then a wider interval may be of interest. In this case the full range of the volume fraction of the organic solvent in the mobile phase over which the results of the method are acceptable is sought. The inherent problem in this type of investigation is the number of experiments, and thus the time taken to explore the acceptable range. Ideally an interval is predicted in advance and then confirmed experimentally. This may be achieved if computer modelling is used for the method development. A virtual model of a separation may be created using the data obtained from a small number of experiments, allowing optimization of method conditions without having to inject any samples on the HPLC system. Software packages which enable this include ACD/LC Simulator (Advanced Chemistry Development, Inc.) and DryLab® (Molnár-Institute for applied chromatography).


