In a previous article (Measuring Dwell, HPLC SOlutions #86) we looked at a simple technique to measure the dwell volume of an HPLC system. In a prior discussion (Dwell Differences, HPLC Solutions #85), it was seen that differences in dwell volume between two HPLC systems could result in offset retention times as well as possible changes in resolution for early-eluted peaks. Another potential problem can be diagnosed using the same dwell-volume test, as is discussed below.
The Setup
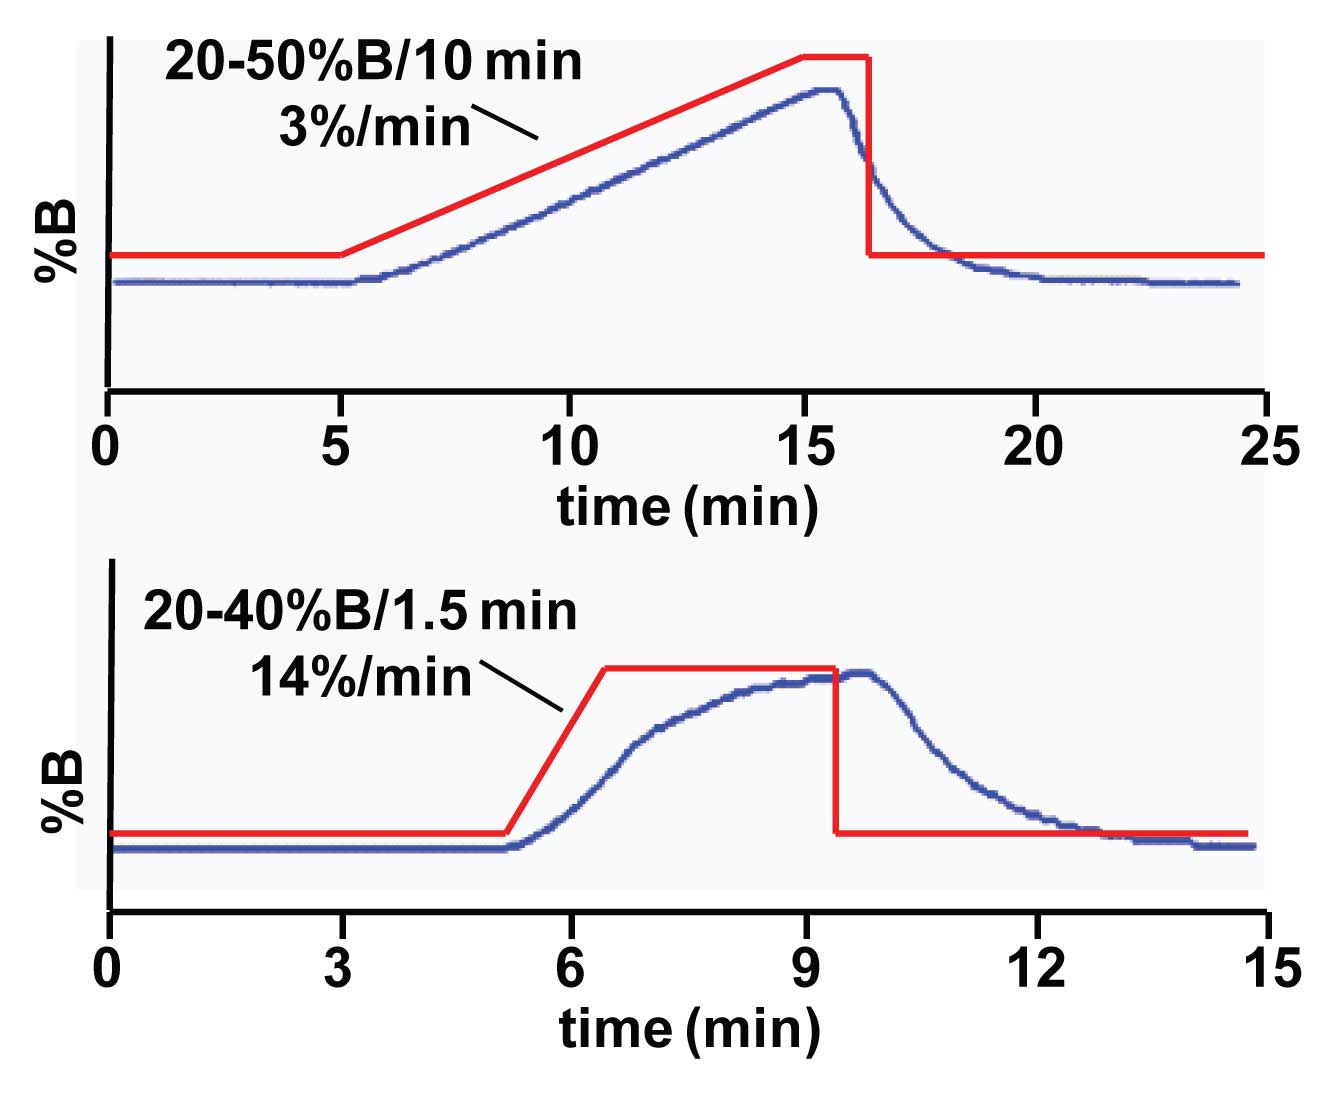
In the current example, the experimental setup is the same as that of the standard dwell-volume test discussed last week, with the exception that the column was left in the system. Instead of water-based solvents, this test needs to be done with methanol-based solvents, because the column is installed. So use A = methanol and B = methanol + 0.1% acetone. In this case, the column was 100 x 2.1 mm, operated at 0.2 mL/min on a system with 1 mL of dwell volume (1). In the upper chromatogram of Figure 1, as can be seen by the red line, a 20-50% B gradient was programmed over 10 min, resulting in a gradient of 3% B/min. There was a short isocratic hold, then a step back to the initial conditions. In the lower chromatogram, the gradient was 20-40% B in 1.5 min for a 14% B/min gradient. A 3-min isocratic hold was followed by a step back to the initial conditions.
 Figure 1
The Results
In Figure 1, the blue trace shows the gradient as it appears at the detector. In the ideal world, this would be expected to closely track the gradient program (red line). In the upper chromatogram, the blue line follows the red one quite well during the gradient portion. On the step back to the initial conditions, it takes a while for the actual gradient to catch up with the program. But this is not surprising – after all, isn’t this why we wait between runs for the column to re-equilibrate? However, note the contrast with the lower example. In this case the actual gradient cannot keep up with the program, and it takes the entire 3-min hold for the gradient to reach its maximum concentration. So, although a linear 14%/min gradient was programmed, this is not at all what was produced by the HPLC system. Imagine how different the chromatogram might look if it were developed on a system that closely tracked the program, similar to the top case, and were transferred to a system that gave a distorted gradient, as is the lower case!
Furthermore…
The scary part about this example is that it is common to program a step gradient as part of a gradient method. This might link two isocratic segments or might be a very steep gradient before or after a shallow segment. HPLC system controllers allow you to program any gradient conditions you want – even if they are not realistic. So the take-home message here is that if you plan to use steps or steep segments in your gradient programs, it is a good idea to use the methanol-acetone gradient technique to see what the gradient really looks like. If your system does not produce gradient segments that closely track those you have programmed into the system, you could be in for a very unpleasant surprise when you try to transfer the gradient to another HPLC system that may have different mixing characteristics.
Reference
(1) G. Hendriks, J.P. Franke, and D.R.A. Uges, J. Chromatogr. A,1089 (2005) 193.
This blog article series is produced in collaboration with John Dolan, best known as one of the world’s foremost HPLC troubleshooting authorities. He is also known for his research with Lloyd Snyder, which resulted in more than 100 technical publications and three books. If you have any questions about this article send them to TechTips@sepscience.com


