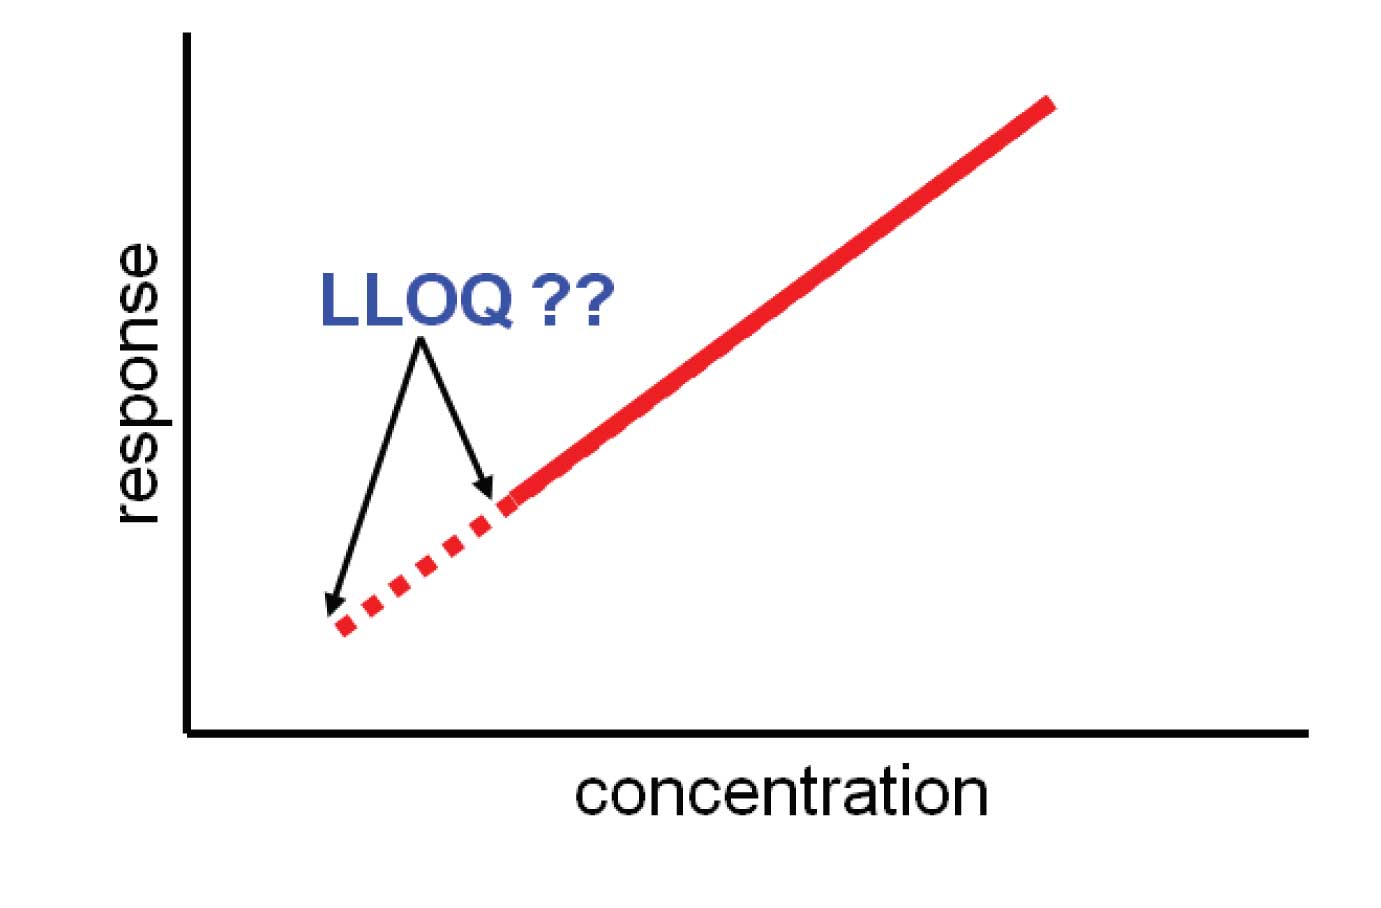
A reader recently emailed me a question that went something like this: “I’m using LC-MS/MS to analyse a biomolecule that I have isolated from tissue by LC-MS/MS. The lowest point on the calibration curve that I prepared is 0.1 µM. All the samples we’ve tested have concentrations above 0.1 µM and the signal-to-noise (S/N) is 33 at this concentration. I know that S/N = 10 is considered the lower limit of quantification (LLOQ) – does this mean that I have to extend my curve downward, even if I’ll never see concentrations that low?”
Key Concepts in LLOQ Calculation
The short answer to the above question is “no.” Let’s consider the limit of detection (LOD) and LLOQ for a moment. When we declare a LOD, we usually are meaning, “I have confidence that the compound is present, but I can’t tell you how much is there.” In a similar manner, LLOQ means, “I know the compound is present, and I can tell you how much is there with x degree of confidence.” There are various ways to define LOD and LLOQ. One of the most common ones is the one mentioned, referencing the International Committee on Harmonization (ICH) and other regulatory groups, and this is based on S/N. LOD is defined as S/N of 2:1 or 3:1, whereas LLOQ is defined as 10:1. These S/N ratios were chosen, because they represent signals (peak heights) that are large enough to give reliable results for a particular application. I prefer the performance-based definitions of LLOQ that come from the US Food and Drug Administration’s (FDA) “Guidance for Industry: Bioanalytical Method Validation” document. In this document, it is recommended that samples at the LLOQ have imprecision of no more than ±20% and all concentrations above the LLOQ have ±15%. This side-steps concerns about particular S/N values and considers instead how well the method performs. Of course, these two techniques of determining method limits are related, as discussed in an earlier article (The Importance of Signal-to-Noise). That is, the %RSD of a method can be related to S/N.

Applying LLOQ in Bioanalytical Method Validation
So where is all this taking us? My interpretation of both the ICH and FDA documents is that whatever LLOQ you choose, it has to have sufficient signal to give you confidence in the measurement. You also have to demonstrate the imprecision of the measurement at the LLOQ based on samples spiked to the LLOQ concentration. In the present case, samples should be spiked at the 0.1 µM concentration and several replicates should be run (e.g., n = 6). If the results meet the precision and accuracy criteria of ≤±20% for a bioanalytical method, all should be OK. And the reader’s question implies that the results will be <<±20%, so having the curve end at 0.1 µM should be fine.
This blog article series is produced in collaboration with John Dolan, best known as one of the world’s foremost HPLC troubleshooting authorities. He is also known for his research with Lloyd Snyder, which resulted in more than 100 technical publications and three books.


