Save 50% on the cost of your LC-MS! Now that I have your attention, perhaps I shouldn’t make such a grand claim – maybe only 40%. Of course I’m talking about operating costs, not the purchase price, but if it means that you can do the work of two LC-MS units by making more efficient use of a single LC-MS, isn’t this the same colour of money?
The technique is based on a process of column switching. This also assumes that the mass spectrometer, whether it is a single quadrupole (LC-MS), triple quadrupole or tandem (LC-MS/MS), ion trap, or other MS detector, is not fully utilized. That is, only part of its time is used looking at peaks of interest – the balance of the time is spent looking at uninteresting baseline at the beginning or end of the run or waiting for the column to re-equilibrate in gradient methods.
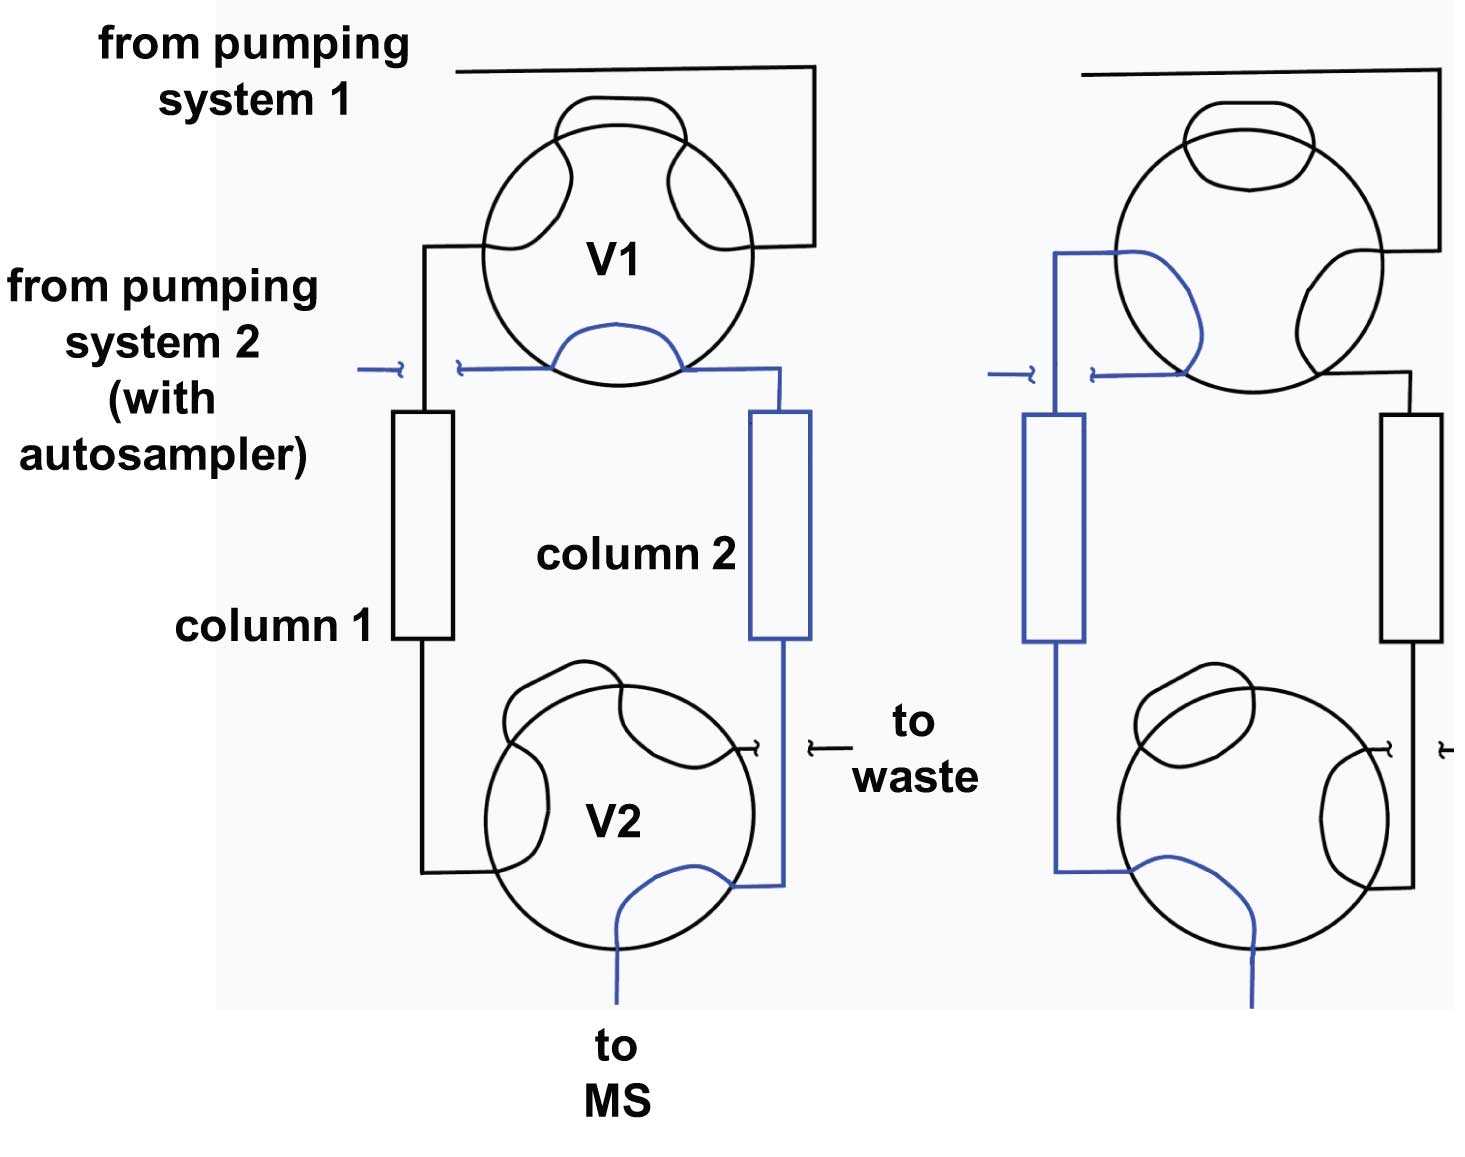
 Figure 1
The setup is shown in Figure 1. All that we have to add to a normal LC-MS system is a second column, a couple of switching valves, and a second pumping system. In the configuration shown in Figure 1, one pumping system (System 1) serves to flush and/or equilibrate the column between injections. I have shown two 6-port switching valves, V1 and V2, but a similar setup can be configured with a single 10-port valve. System 2 comprises the pump that is used to elute the column plus an autosampler to introduce the samples onto the active column.
The system works like this: In the configuration on the left side of Figure 1, Pump 2 and its associated autosampler injects sample onto Column 2 and elutes it into the MS detector. Meanwhile, Pump 1 flushes and equilibrates Column 1, preparing it for the next injection. Pumps 1 and 2 can be isocratic or gradient, depending on the method requirements. As soon as the last peak of interest has eluted from Column 2, both valves switch to the configuration on the right side of Figure 1. Now System 2 injects onto Column 1 and Column 2 gets flushed and equilibrated by System 1.
With the setup in Figure 1, it is possible to reduce the effective run time by half. However, from a practical standpoint, this usually is not possible. This is because you should run a separate calibration curve for each column. This means that there is a bit of extra overhead involved with the two-column setup. For example, let’s say that you have 400 samples (including quality control samples) to run and that normally you run a 10-point calibration curve at the beginning and end of each sample batch. We’ll also assume a 5-min run from injection to injection. So your batch of samples will take (400 samples + 20 calibrators) x 5 min = 35 hr. If you use the column switching scheme to speed up the process, you would split the samples between the two columns, but you would have to duplicate the calibration runs. This would mean (200 samples + 20 calibrators) x 5 min = 18.4 hr, not quite doubling the throughput.
Another adjustment or two have to be made to sort out the data. Most HPLC systems allow you to program the autosampler to pick up alternate samples from two different trays or plates, but unless you go to a lot of work to program the system, the chromatograms will all end up in the same data sequence. That is, the data file sequence will be: sample 1 – tray 1, sample 1 – tray 2, sample 2 – tray 1, sample 2 – tray 2, etc. This means that after the batch is finished, you will need to separate the two data sets, and each data set will need to be worked up separately. Some people might argue for using a single calibration curve for all the injections, pooling all the results, but I feel that this is not as wise as treating the samples run on each column as separate batches.
And what happens if there is a glitch in the sequence and the sample sequence gets mixed up? We had a concern about this in our lab when we first tried the column switching technique, so one option was to add another compound to one set of samples and not to the other. This was used as a marker to confirm which sample set was being recorded. Another option would be to use two different spiking levels for the internal standard added to the two sample sets. However, with experience, we realized that there usually was enough difference between the two columns that there was a slight retention-time bias between the two columns, so it was easy to determine which set of samples was being observed.
So, if you haven’t tried this trick yet, it is a small investment for a large return in time savings. And as the saying goes, “time is money.”
This blog article series is produced in collaboration with John Dolan, best known as one of the world’s foremost HPLC troubleshooting authorities. He is also known for his ongoing research with Lloyd Snyder, resulting in more than 100 technical publications and three books. If you have any questions about this article send them to TechTips@sepscience.com


