As we saw in HPLC Solutions #125, the International Committee on Harmonization (ICH, 1) lists three ways to determine the limit of detection (LOD) or limit of quantification (LOQ):
- based on visual evaluation
- based on signal-to-noise
- based on the standard deviation of the response and the slope
Recall that a simple definition of the LOD is something like, “I’m sure there is a peak there for my compound, but I cannot tell you how much is there.” For the LOQ, we might say, “I’m sure there is a peak there for my compound, and I can tell you how much is there with this much certainty.”

ICH Method Based on Standard Deviation
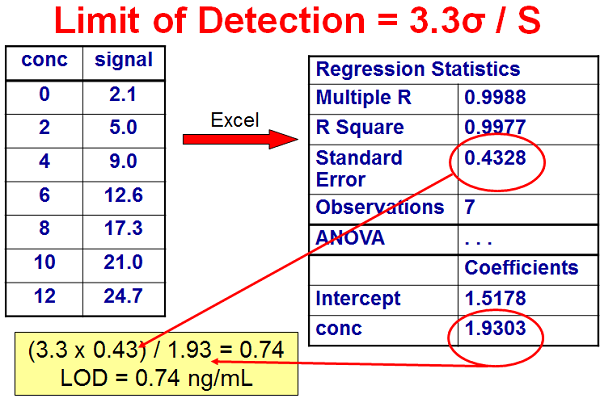
In HPLC Solutions #125 we looked at the first two techniques. Now let’s look at the third one. I’ve summarized some data in Figure 1 that will be useful for the present discussion. The ICH indicates that LOD (which they call DL, the detection limit) can be calculated as LOD = 3.3σ / S, and the limit of quantification (which they call QL, the quantitation limit) LOQ = 10σ / S. Here σ is the standard deviation of the response and S is the slope of the calibration curve. S is estimated from the slope of the calibration curve for the analyte. σ can be determined in one of two ways: (1) Based on the standard deviation of the blank, where blank samples are run and the standard deviation is determined; this is equivalent to the standard deviation of the noise (or root-mean-square, RMS, of the noise).
Or (2) from the standard deviation of the calibration curve that contains samples in the range of the LOQ; this can be measured as the standard error of the calibration curve or the standard deviation of the y-intercept. I think the standard error (SE) method is the simplest, because it is easily obtained from a regression analysis of the calibration curve.

In Figure 1, I’ve listed a set of concentrations (ng/mL) and signal (area) for a calibration curve. These data can be analyzed by a linear regression algorithm, such as is included in most data system software. I’ve chosen to use the linear regression data that can be obtained in Microsoft Excel. On the upper right, I have listed some of the key data presented in the regression report. The 4th item down, the standard error, is the standard deviation about the regression line for the entire data set, which I am using as σ for the ICH technique. The slope of the calibration curve is listed at the bottom, labeled as the concentration coefficient. Using these numbers, we can calculate LOD = 3.3 x 0.4328 / 1.9303 = = 0.74 ng/mL. In a similar manner, LOQ = 10 x 0.4328 / 1.9303 = 2.2 ng/mL. I would probably round these up to 1 ng/mL and 2.5-3.0 ng/mL.
The values calculated above should be considered estimates of the LOD and LOQ, and must be demonstrated by injecting multiple samples (e.g., n = 6) at the LOD and LOQ concentrations. If the results meet performance requirements, the LOD and LOQ have then been shown to be correct. Here is where the other LOD and LOQ techniques can be useful. Do the proposed LOD and LOQ appear to be visually reasonable? Does the LOD consistently meet the S/N of 2H/h requirements of 3:1 or 2:1? Does the LOQ consistently meet a S/N or 2H/h of 10:1 and have acceptable precision (e.g., ±15%)?
Validation and Considerations
I find that the determination of LOD and LOQ based on the calibration curve to be much more satisfying from a scientific standpoint. The visual and S/N techniques seem too arbitrary to me for anything other than confirming that the regression technique gives reasonable values. Remember, however, no matter which technique you choose, the ICH requires that as part of the validation process you should analyze a suitable number of samples prepared at or near the LOD and LOQ to demonstrate that the proposed method limits are appropriate.
International Committee on Harmonization, “Validation of Analytical Procedures: Text and Methodology, Q2(R1), Nov. 2005.
This blog article series is produced in collaboration with John Dolan, best known as one of the world’s foremost HPLC troubleshooting authorities. He is also known for his research with Lloyd Snyder, which resulted in more than 100 technical publications and three books. If you have any questions about this article send them to info@sepscience.com


