This installment of HPLC Solutions begins a series on different measurements that we make on chromatograms. Measuring the baseline noise generated by an HPLC system may seem like a singularly boring subject. But if you think about it, noise can be a critical factor in the results of our analytical work. It is directly related to the limit of detection and limit of quantification, it can be used to determine the health of the detector, noise is a great diagnostic tool for problems, and can be a limiting factor in the precision of a method.
To assess baseline noise, we need to record a representative baseline. The most convenient way to do this is to make a chromatographic run without any injection. In some cases, such as detector assessment, a specific mobile phase may be suggested by the manufacturer, but most of the time we’re interested in the baseline noise for a particular method, so running the method as described is the best way to gather the data.
Some data systems make it possible to measure the noise directly from the baseline by using the Root Mean Square (RMS) function. This is identical to the standard deviation of the of the baseline noise. While this may seem like a much less biased and simpler method to use than manual measurement, there is no simple conversion between RMS noise and manual measurements. Manual measurements are the basis of the pharmacopoeial (e.g., USP, EP, BP, JP) and ICH (International Committee on Harmonization) applications of the baseline noise to limit tests of chromatographic methods. For a given set of conditions with variables held constant, there should be a direct conversion between RMS and manual noise measurements, so RMS can be used as a way to monitor system suitability, for example, but only for a given method under controlled conditions. For this reason, we’ll concentrate on manual measurement of the baseline noise.

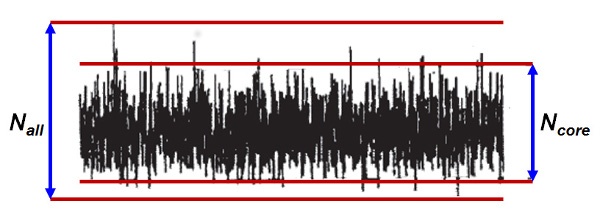
The figure shows a representative segment of the baseline of a chromatogram. Usually this should be equivalent to at least five times the width of the peak of interest at half-height, and sometimes 20 half-widths is recommended. From a practical standpoint, you need enough baseline that you aren’t hiding normal and random excursions of the baseline that might be encountered.
To make the measurement, expand the scale on the chromatogram so that the noise is clearly visible. There are two approaches to measuring noise, as illustrated. One is to draw lines parallel to the baseline that capture most of the noise, ignoring the occasional outlying spike. This is sometimes called “core” noise, Ncore. The alternative is to draw parallel lines that capture all the spikes, Nall. Statistically, Ncore can be approximated by 4 standard deviations (SD, σ) of the noise, and Nall of 5-6σ. Because selection of the exact position to draw the noise limits is somewhat arbitrary and the application of the determined noise value is most important at the limits of a method, where uncertainty is the greatest, it doesn’t matter from a practical standpoint which method to use. Often you see peak-to-peak noise (Np-p) referenced, and it can refer to either technique. In the further discussion of noise, we’ll assume this Np-p definition – it really doesn’t matter which technique we use because the uncertainty of the measurement makes this a moot point.
The measured noise usually is converted to detector response units, such as absorbance units (AU) for a UV detector. When considering limit measurements, such as the signal-to-noise ratio, other units or no units at all may be more appropriate. We’ll see the application of noise measurements in future HPLC Solutions installments.
This blog article series is produced in collaboration with John Dolan, best known as one of the world’s foremost HPLC troubleshooting authorities. He is also known for his research with Lloyd Snyder, which resulted in more than 100 technical publications and three books. If you have any questions about this article send them to TechTips@sepscience.com


