In the last HPLC Solutions #111, we looked at the influence of signal averaging on baseline noise for a simulated chromatogram. Let’s look now at how the detector time constant can be used to reduce baseline noise. The detector time constant (also called a noise filter) usually is selected through the detector control menu of the HPLC system controller. In its simplest form it is a resistance-capacitance (R-C) filter that you may have seen described in a physics textbook. More sophisticated versions use electronic noise filters that can provide additional smoothing functions. In the present case, we built our own R-C filter with a time constant of 0.15 sec from parts we purchased at a local electronics hobby shop for <$5.
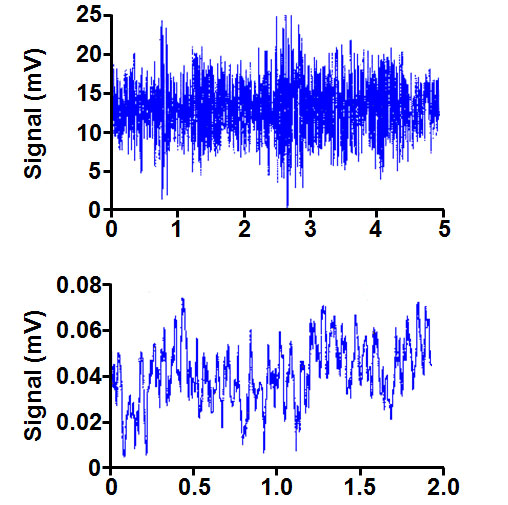
At one point our laboratory suffered from acute 60 Hz electronic noise on the main power circuit. We suspected that this originated from several environmental chambers that we were forced to operate on the same circuit because of power limitations in the building. A typical baseline is shown at the top of Figure 1. The detector output was 1 V / absorbance unit (AU), so the ≈15 mV noise band translates into (15 mV) x (1 V / 1000 mV) x (1 AU / V) = 1.5 x 10⁻² AU of noise. I don’t recall what the detector specifications were, but 5 x 10⁻⁶ AU was typical for detectors at that time. The detector was definitely out of specifications according to the baseline noise.

Figure 1
The high-frequency, 60 Hz (US) or 50 Hz (rest of the world) noise that is observed in the upper chromatogram of Figure 1 is the best kind of noise to have, because it can be reduced very easily using a simple R-C filter or other noise-filtering device. When we applied a 0.15-sec time constant to the signal, the resulting baseline looked like that of the lower trace in Figure 1. This still looks pretty bad, until you look at the y-axis scale. A noise band of ≈0.04 mV translates into (0.04 mV) x (1V / 1000 mV) x (1 AU / V) = 4 x 10⁻⁵ AU. This is still about 10-fold larger than the detector specification, but considering where we started, it is an amazing 375-fold reduction in noise! I suspect that a filter with a larger time constant would reduce the noise even more.
A good rule of thumb for selection of the detector time constant is that it should be no larger than ≈1/10 of the baseline peak width of the first peak of interest. This means that the 0.15-sec time constant used in Figure 1 should be adequate for peak widths of 1.5 sec or larger. What does this translate to in terms of real peaks? A quick calculation will show that the most common column, a 150 x 4.6 mm, 5 µm particle column operated at 1.5 mL/min will have a peak width of about 5 sec for a peak with k = 1. With smaller, 50 x 2.1 mm, 2- or 3 µm column run at 0.5 mL/min, the same peak will have a width of 1.2-1.5 sec. So you can see that the 0.15-sec time constant filter should not compromise any of these peaks.
This blog article series is produced in collaboration with John Dolan, best known as one of the world’s foremost HPLC troubleshooting authorities. He is also known for his research with Lloyd Snyder, which resulted in more than 100 technical publications and three books. If you have any questions about this article send them to TechTips@sepscience.com


