In HPLC Solutions #110 we looked at a problem of baseline noise created by a pump malfunction. In this instalment, we’ll look at what can be done about electronic noise in the chromatogram.
Short-term noise can be defined as background baseline excursions that have a cycle time that is much smaller than the width of a chromatographic peak, usually1 Hz). The most common source of such noise is electronic in nature, such as electronic interference on the power lines from fluorescent lights, motors, and other sources that tend to contaminate the signal with noise at 60 Hz (US) or 50 Hz (the rest of the world). Fortunately, this type of high-frequency noise is reduced easily by the use of electronic noise filtration. This is accomplished by using a detector noise filter, or time constant, and/or adjustment of the data system’s data rate. These two topics will be discussed in the next two HPLC Solutions instalments.

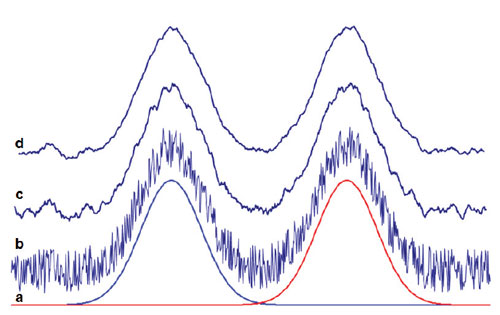
Figure 1
In Figure 1, I’ve shown a portion of a simulated chromatogram for two peaks. At the bottom (a), you can see the two peaks drawn without any added noise. The observed signal would be the sum of the signal from each of the two peaks. It is difficult to determine the signal-to-noise (S/N) ratio because the noise is so small, but S/N >>100.
In Figure 1b, I’ve added some random noise to the signal (and offset it for clarity). This is a combination of high- and low-frequency noise. The high-frequency noise might be the result of an electronic interference on the power line. The low frequency noise is more typical of baseline disturbance due to chemical contamination of the column over time. Here an estimate gives S/N ≈ 3.5, which is near the S/N = 3 cutoff often used for the limit of detection (LOD) for chromatographic methods.
In Figure 1c, a 10-point running average of the chromatogram of Figure 1b is displayed. To do this, each point is averaged with the 9 preceding points and the average is plotted. Similarly, Figure 1d uses a 20-point running average. Although this type of filtering is not exactly what a detector noise filter would use, it gives us the idea of what signal averaging can do to smooth out the baseline. You can see that the addition of filtering to the baseline removes most of the high-frequency noise and leaves only the low-frequency noise. As a result, the signal-to-noise ratio rises to S/N ≈ 10 in these two cases, which coincides with the cutoff value often used for the limit of quantification (LOQ).
It is obvious that the more filtering that is applied, the smoother the signal appears. However, there is a point at which the filtering is no longer beneficial. As more and more points are averaged together, it can be understood that eventually the highest points on the peak will be averaged with lower ones, depressing the peak maximum. Similarly, the points across the valley between the two peaks will be averaged, raising the valley. The consequence is loss of peak height (sensitivity) in the first case, and loss of resolution in the second. A good rule of thumb is that if a detector time constant is used to smooth the signal, its value should be no more than ≈1/10 of the baseline peak width of the first peak of interest. If the data system’s data rate is used as a filter, a minimum of 10-20 points should be gathered across the peak. These settings are a compromise between improving the appearance of the baseline and maintaining the integrity of the peak.
Just a reminder: the chromatograms in Figure 1 are fabricated to illustrate the influence of noise and signal averaging on the chromatogram. They may not be a good reflection of the actual signal averaging result with real chromatograms. In the next two instalments of HPLC Solutions, we’ll look at the influence of the detector time constant and the data system data rate.
This blog article series is produced in collaboration with John Dolan, best known as one of the world’s foremost HPLC troubleshooting authorities. He is also known for his research with Lloyd Snyder, which resulted in more than 100 technical publications and three books. If you have any questions about this article send them to TechTips@sepscience.com


