Q: I know that retention varies according to the ionization of a compound. If the compound is ionized, the retention generally is shorter than if it is not ionized. Does this mean that I should expect two peaks if the compound is near the pKa, where it is half-ionized?
A: The simple answer is that you will see only a single peak in the case of ionization of an acidic or basic solute. You are correct that the more ionized a compound is, the shorter its retention tends to be, assuming reversed-phase retention. This is because the ionized solute is more polar than the non-ionized one. For example, a carboxylic acid at pH-2.5 generally will be in an ion-suppressed state, which will increase its retention compared with the same compound at pH-7.0, where it will be ionized, and thus more polar. A partially ionized acid will have a retention time somewhere between these two extremes. This is the primary reason why pH is such a powerful variable to use for fine-tuning peak spacing with samples that contain ionizable solutes – adjustment of the pH will allow retention time adjustments, hopefully moving analytes to regions of the chromatogram where no interfering compounds elute.
 Figure 1
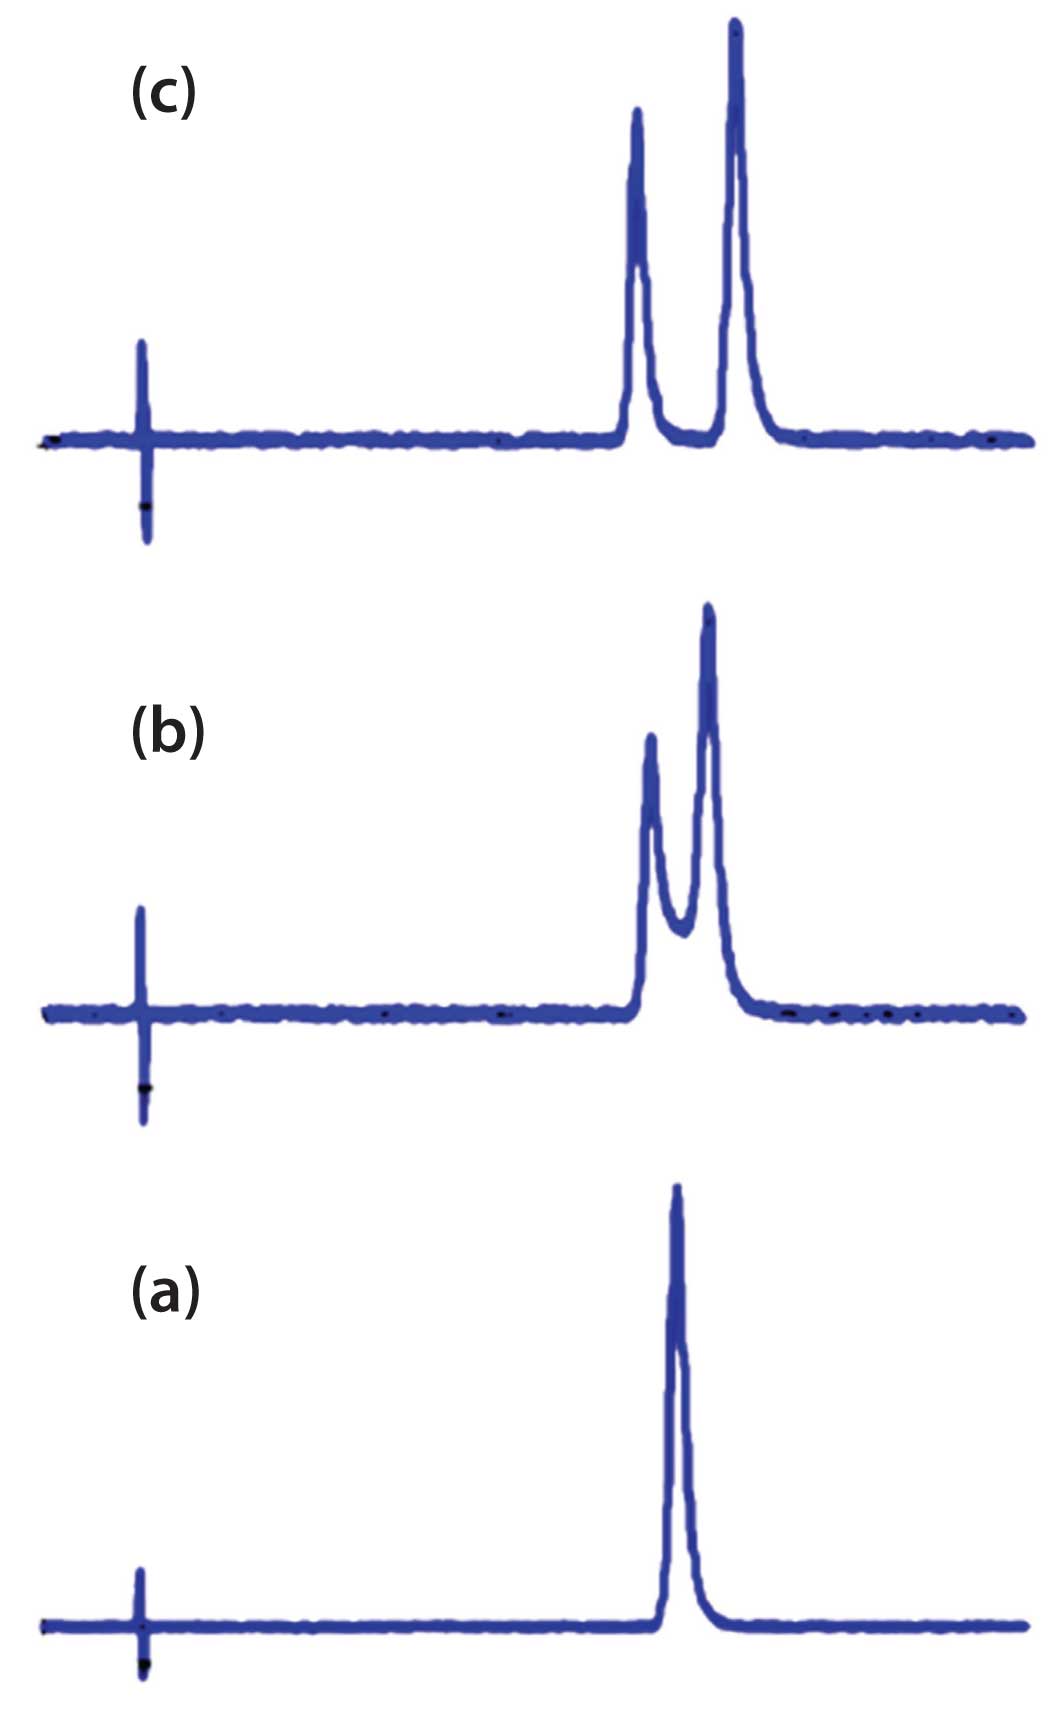
So why don’t we see two peaks when the solute is partially ionized? Certainly both the ionized and non-ionized forms are present, and at first glance, you would think that two peaks would result. The reason is that the equilibrium between the two forms is very fast – instantaneous in terms of chromatographic time. When the equilibrium is very rapid when compared with the chromatographic migration time, a single, sharp peak will appear, as is shown in Figure 1(a).
At the other extreme are compounds that exist in two forms that convert very slowly between the two forms – conversion times that are significantly longer than the chromatographic retention times. In this case, two distinct peaks are seen, as is shown in Figure 1(c). Examples include cis-trans isomers and chiral enantiomers (which, of course, need a chiral column to separate the two forms). Any compound that can be isolated from a mixture in two forms would fall into this category. The reason for this is that if the conversion time is longer than the retention time, either form can pass through the column before it gets converted to the other form.
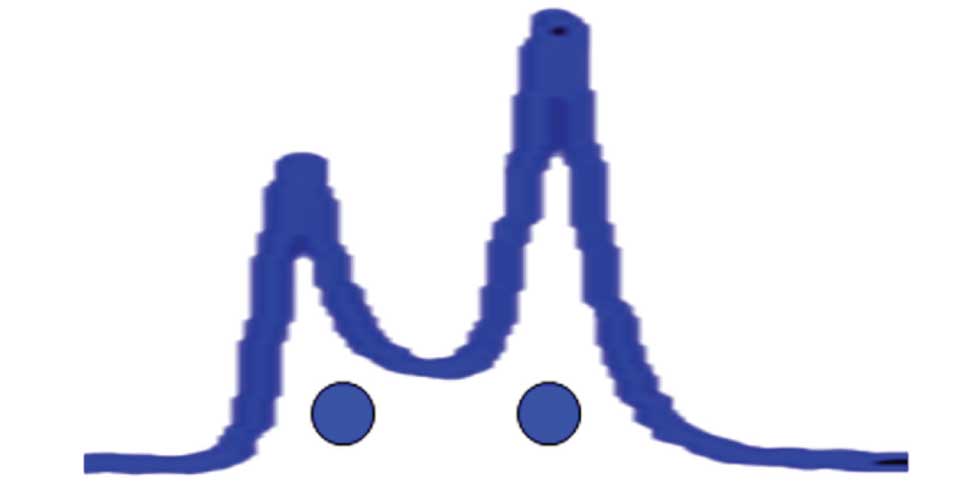
The final case is for those compounds in which the conversion rate between two forms is similar to the time it takes to pass through the column. In such cases, it may be possible to see two peaks for the two forms. This is illustrated in Figure 1(b). However, because one compound is being converted to the other as the analyte travels through the column, not only are the two distinct forms seen, but some of the molecules travel down the column partly as one form and partly as the other. This gives them intermediate retention times. Depending on where the conversion takes place, the eluted molecule will lie at different retention times relative to the two “pure” forms. This can result in a saddle between the two peaks, as shown in Figure 1(b). In our laboratory, we affectionately call these “Bat-o-grams,” because they can look a bit like Batman’s profile. I’ve stretched out the peaks of Figure 1(b) to illustrate this in Figure 2 (with eyes added for effect… sorry!). The place I’ve seen this behaviour most commonly is with biological molecules, such as proteins or enzymes, where on-column degradation results in a peak for the native form and one for the degraded form, with a smeared saddle between the two. Often only a single sharp peak (native or degraded) is seen, with the remainder of the sample smeared out as a broadly distorted front or tail on the peak.
 Figure 2
This last case, of degradation or conversion on column, is of most concern from a quantitative viewpoint. It is very difficult to quantify such peaks, because the ratio of the two forms (and the saddle between them) may change from run to run. You can prove that conversion is happening by changing the conditions to favour one form or the other. For example, if the conversion is temperature-related, you can raise or lower the column temperature to see a difference in the ratio of the two peaks. In other cases, there is some catalysis on the column that can be modulated by the flow rate or time of exposure. Or perhaps the conversion/degradation is a result of the mobile phase – change the pH, salt concentration, or other variable in the mobile phase to investigate this.
In summary, it is not common to see two peaks where a conversion between two structural forms of an analyte takes place while the compound travels through the column. The most common occurrences are the examples of Figure 1(a) and 1(c), where a single peak is seen for rapid inter-conversion or two nice, sharp peaks for very slow conversion. The Bat-o-gram of Figure 1(b) is a rare observation for most of us, although the biochemist may encounter this more commonly.
This blog article series is produced in collaboration with John Dolan, best known as one of the world’s foremost HPLC troubleshooting authorities. He is also known for his ongoing research with Lloyd Snyder, resulting in more than 100 technical publications and three books. If you have any questions about this article send them to TechTips@sepscience.com


