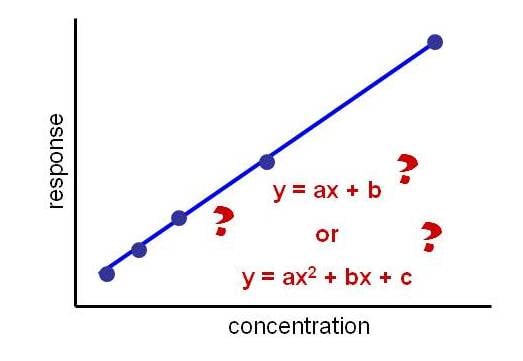
Q: I have a problem with the linearity of my HPLC method. The method involves derivatization of the analyte, followed by reversed-phase separation with UV detection. To my surprise, the calibration curve fits a quadratic form very nicely, and not a linear plot. Can you give me some advice on what I might be doing wrong?
A: First, although most of us are used to working with linear calibration curves, other response functions may be appropriate for certain methods and certain detectors. However, from your question, I assume that you have other information that says the calibration should be linear.
 Figure 1
There are several possible sources of non-linearity in most HPLC methods – the most common are the sample itself, the injection process, and the detector. Let’s look at each of these; I’ll address them in reverse order.
UV detectors have a wide range of linearity – linear response up to 1.0 absorbance unit (AU) is standard on nearly all detectors. Some manufacturers claim linearity to higher responses, such as 2.0 AU. I am rather conservative, and like to keep the signal below 1 AU, with a target of no more than ≈0.9 AU for the largest peak of interest. This just keeps everything in a safe response region. You can quickly check the detector as a source of non-linearity by examining a few chromatograms. How big are the largest peaks? If they are larger than 1 AU, try re-calculating the calibration plot using only peaks withAutosamplers are extremely precise, but not necessarily as accurate. For example, tests of the autosamplers in our lab typically give imprecision in the 0.3% RSD range for n = 6 x 10 µL injections. Some autosamplers are very good at dispensing the exact volume selected, whereas others are not so good. For example, because of the fluid flow characteristics, you may program 20 µL for the injection, but find that only 18 µL are delivered. This is fine with me, because I’m more interested in precision than accuracy. I use the same volume for both standards and samples, so any error in volume drops out. However, if you make your standard curve by making a series of injections at different volumes, you may not get as good results.
For example, a series of 1, 2, 5, 10, 20, 50, and 100 µL of the same standard may not give as good linearity as making the same volume (e.g., 20 µL) of standards diluted to the appropriate concentrations. Dilution in volumetric glassware usually is more accurate than the ability of the autosampler to dispense different volumes. If you are using different volumes of the same concentration of standard, try making up the dilution series and injecting the same volume to see if this straightens out your standard curve.
The final area that may be a problem, and I suspect this is likely the case, is the sample preparation process. The derivatization or some other step in the process may not be linear. I would check this by making two sets of samples to compare. First, make a high concentration of a reference standard and derivatize it. Then dilute the derivatized solution to form a series of diluted standards. Inject the same volume of each of these and plot the calibration curve. For comparison, make the dilution series of underivatized standards and then derivatize them. In theory, both sets of calibration standards should give the same results, but you may find a difference in the way the two respond that will lead you to the root cause of the problem. Such things as the presence of excess reagent, adsorption on surfaces, reaction time, or other variables are possible sources of the problem.
As with so many HPLC problems, if you break down the problem into its component steps and establish the behaviour of each step or component, you usually can solve the problem.
This blog article series is produced in collaboration with John Dolan, best known as one of the world’s foremost HPLC troubleshooting authorities. He is also known for his research with Lloyd Snyder, which resulted in more than 100 technical publications and three books. If you have any questions about this article send them to TechTips@sepscience.com


