In the previous three instalments of this series ('#7: Fundamental Resolution Equation, Part 1', '#8: Fundamental Resolution Equation, N', '#9: Fundamental Resolution Equation – Alpha'), we’ve looked at the fundamental resolution equation
Rs = ¼ (N)0.5 (a-1) (k / [1+k]) (1)
Where N is the column plate number or efficiency, a is the selectivity, and k is the retention factor. We saw that because of the poor resolution leverage gained by the square-root dependence of N, it is best to pick a column with a reasonable plate number in the beginning, but to wait for further investigations of N until later. Last week we looked at α, and found that, although it is the most powerful variable to use to change resolution, it is also not very predictable, so it is best left until later to investigate thoroughly. This week we’ll look at the relationship between resolution and k.
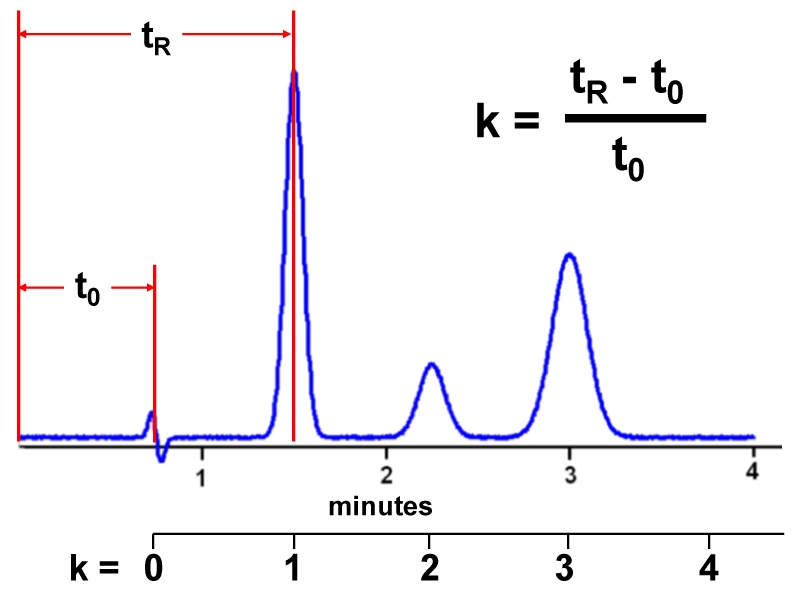
 Figure 1
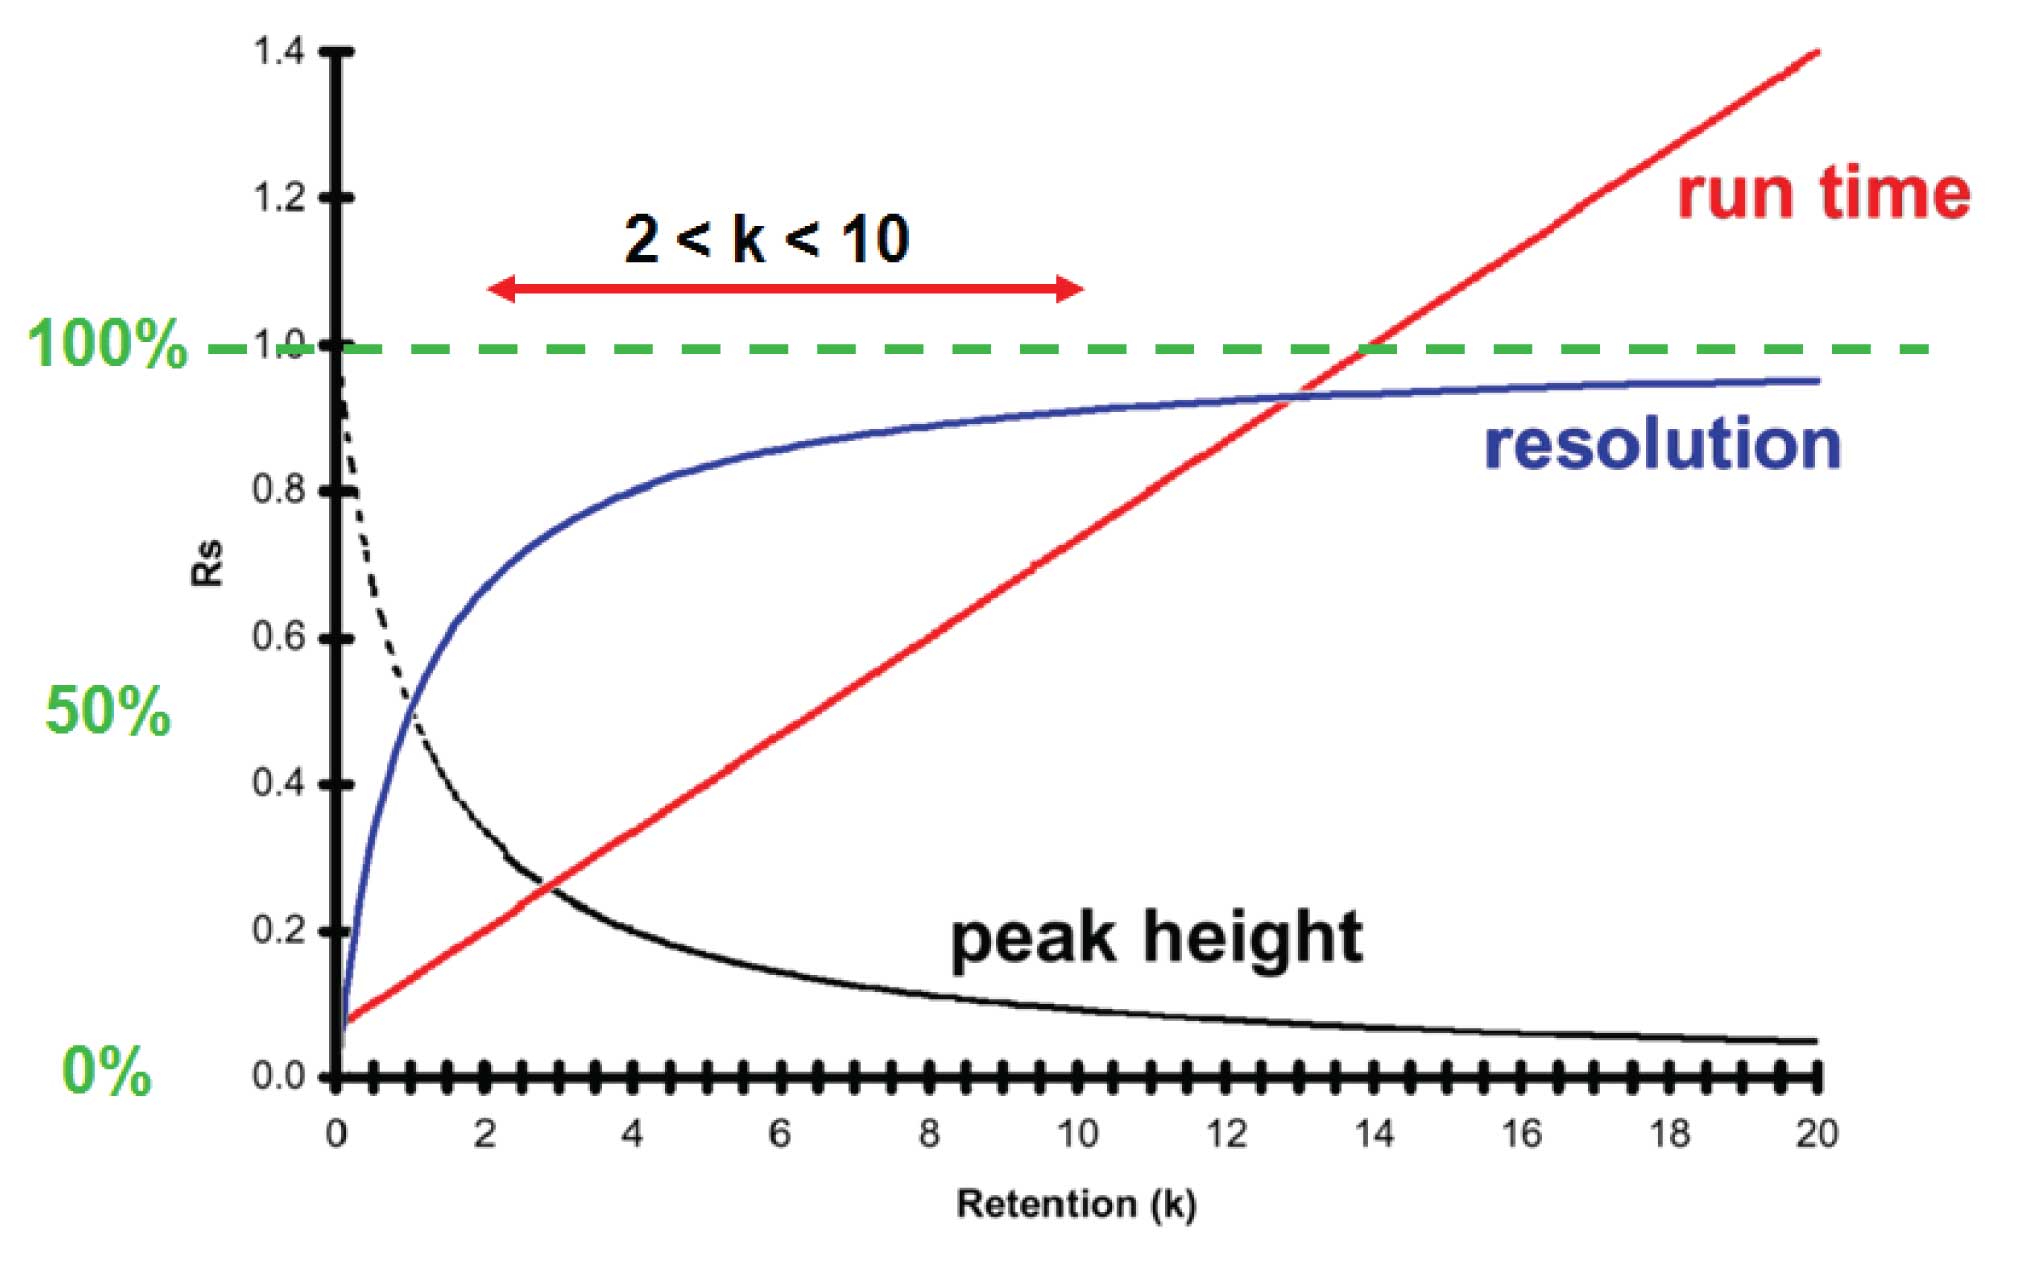
Let’s look at the k-term of equation 1. If k is small, for example, 1, we get a value of 1/(1+1) or 0.5. If k is quite large, for example, 100, we get 100/101 ≈ 1. So, as k is increased, Rs is increased, but not in a linear fashion. As we did in the previous discussions for N and a, we can plot Rs against k, as shown in Figure 2. Here you can see that there is a steep rise in resolution at small values of k which levels off as k is increased.
I often recommend that you will get the “best” chromatography if you can obtain k-values in the range of 2 < k < 10, or if the sample polarity range is larger so that all the sample peaks won’t fit into this range, 1 < k < 20 also is acceptable. These recommendations are based on Figure 2. In chemistry, we often see curves such as the blue one of Figure 2 – for example with reaction completion. We like to work up on the flat portion of the curve, because we can tolerate small changes in the independent variable (k in this case) with insignificant changes in the dependent variable (Rs). If 2 < k < 10, we are in the flat portion of the curve, so we are likely to get more robust separations than if k < 2. Also, the contribution of k to Rs is in the 70-90% range of the maximum, which means that we have obtained most of the “leverage” of k as a variable to improve resolution when 2 < k < 10.
 Figure 2
For values of k < 2, for example, k = 1, we are taking less advantage of k as a variable than at larger values. More importantly, we are in a steep part of the k vs. Rs curve, meaning that small changes in k will result in larger changes in Rs, for a less robust separation. Finally, with small values of k, the peaks will come out quite early in the chromatogram and are more likely to encounter interference from the unretained junk that elutes at the front of the chromatogram. Looking at the other end of the 1 < k < 20 range, there is no particular advantage of large k-values in terms of resolution. And the separation suffers from longer run times and broader peaks, which in turn mean shorter peaks and poorer detection limits.
Because of the relationship of k and Rs shown in Figure 2, it usually is best to start method development by choosing a column with N ≈ 10000, then to adjust k to obtain 2 < k < 10 if possible, or 1 < k < 20 if necessary. Once k is optimized, then a can be addressed if more selectivity is needed.
This blog article series is produced in collaboration with John Dolan, best known as one of the world’s foremost HPLC troubleshooting authorities. He is also known for his research with Lloyd Snyder, which resulted in more than 100 technical publications and three books. If you have any questions about this article send them to TechTips@sepscience.com


