As part of the HPLC Master Classes that I teach, I start each class by gathering questions or topics that the attendees would like to know more about. In a recent class in London, one of the topics was the causes of excessive retention – a method in which the retention times are longer than they used to be. There are a number of possible causes of increased retention in HPLC separations – let’s take a moment to highlight some of these. If we stop and think about it, there are just a few variables that control retention in HPLC. The primary ones are flow rate, temperature, mobile-phase composition, and column chemistry.
Flow Rate
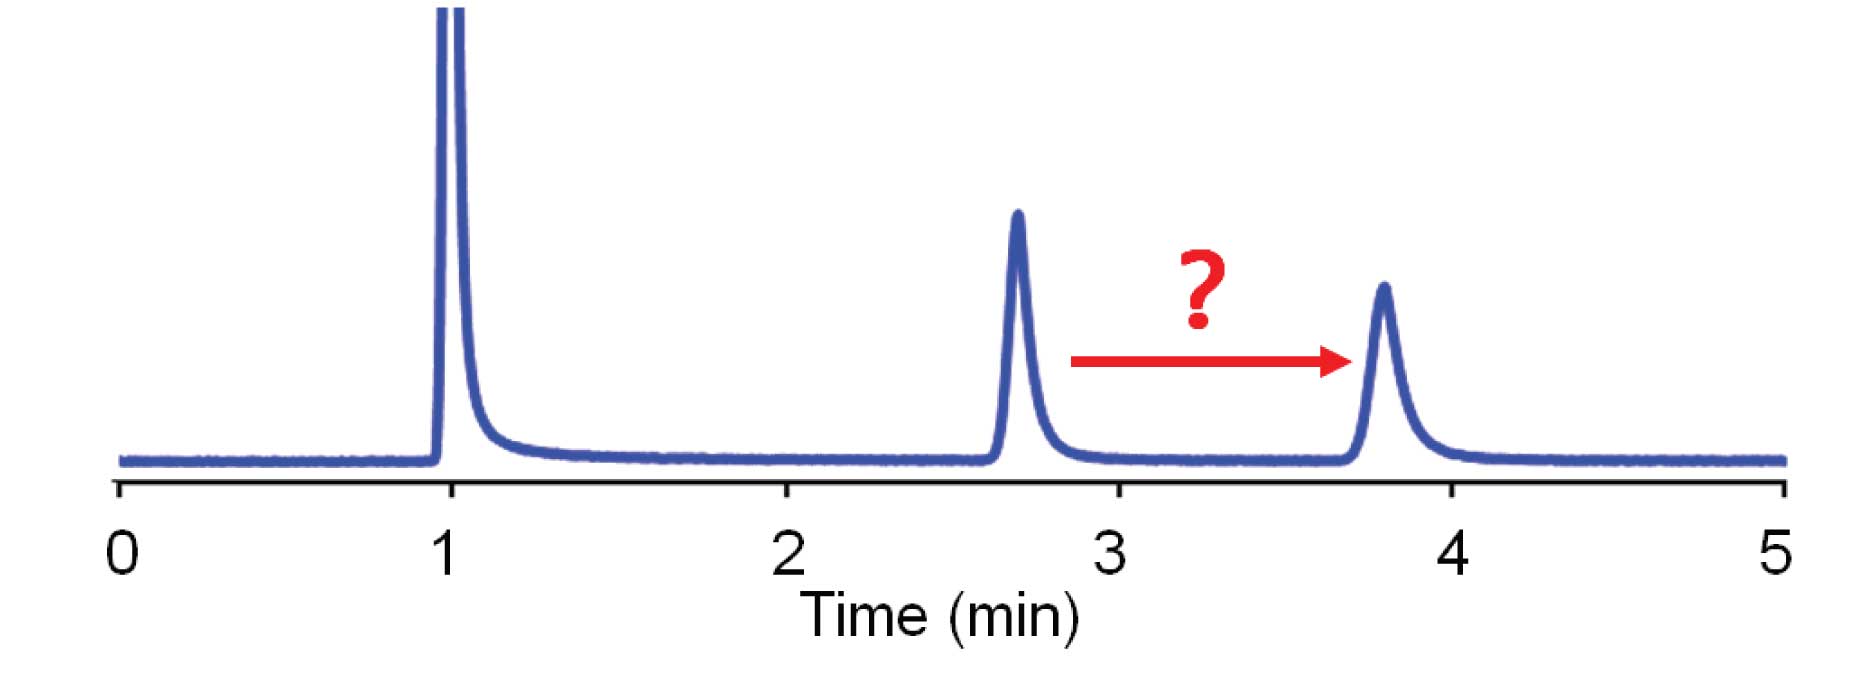
An increase in retention, such as that shown in Figure 1, can result from a drop in the flow rate. If this is suspected, it always is wise to check the setting to be sure you didn’t make a mistake. Another thing to double-check is to look at the unretained peak at the beginning of the run – did it change, too? If the peak at the solvent front also shifted, the cause is most likely a flow-rate change. Check for a bubble in the pump, a faulty check valve, or a broken piston. A secondary symptom would be a drop in system pressure. Another source for reduced flow is a leak – make a thorough check for leaks in the system. If only the analyte peak moves, as in Figure 1, a flow rate change will not be the source, because there is no change in the position of the unretained peak a the beginning of the run.
 Figure 1
Temperature
A change in the column temperature can change retention of just the analyte peak, as we saw in the previous article . The rule of thumb we used for this was a 2% change in retention for each 1 ºC change in temperature. In the present example, the retention changed from 2.8 to 3.9 min, a 40% change in retention. This would require a temperature change somewhere around 20 ºC, which is unlikely in most laboratories. If you are using a column oven, make sure the oven is turned on and is working properly – a malfunctioning column oven could give a 20 ºC change in temperature. This makes sense for the current example, because an increase in retention would result from a decrease in temperature. If the oven was normally run at 50 ºC and had failed, was switched off, or became unplugged, it is likely that the temperature would drop to somewhere around 30 ºC, which would fit the evidence for the chromatogram of Figure 1.
Mobile Phase
The mobile phase, of course, is a major factor in the control of retention. In reversed-phase HPLC, we can estimate the effect of the organic solvent with the Rule of Three, which states that we will see approximately a threefold change in retention with a 10% change in organic. An alternate calculation can be made:
log (∆k) ≈ (4.2)(∆%B) (1)
where ∆k is the change in the retention factor, k , and ∆%B is the change in the %-organic solvent (in decimals). So for the case of Figure 1, k for peak 1 is 1.8 and for peak 2 is 2.9 for ∆k = 2.9/1.8 = 1.6. So ∆%B ≈ log(∆k )/4.2 = log(1.6)/4.2 = 0.048 ≈ 5% change in organic. This is not a wildly impossible change, so it is worth investigating. The easiest way to check is to make a new batch of mobile phase.
A change in mobile phase pH, ion pairing concentration, or other mobile-phase variable also can change retention. If this is suspected, preparation of a new batch of mobile phase usually is the easiest way to confirm it.
Column
As columns age, retention changes usually occur. Such changes tend to be gradual over hundreds of injections. Most commonly, retention decreases are seen when bonded phase loss occurs. Other column changes can cause increases in retention. Check chromatograms over time to see if the change in retention is gradual or abrupt. Gradual changes are more likely because of column problems, whereas abrupt changes tend to be related to the mobile phase. If the column is suspected, replacement of the column with a new one is the easiest way to isolate and correct the problem.
Conclusion
Changes in retention time are not uncommon observations with HPLC methods. We can use the steps outlined here to help isolate the source of the problem.
This blog article series is produced in collaboration with John Dolan, best known as one of the world’s foremost HPLC troubleshooting authorities. He is also known for his research with Lloyd Snyder, which resulted in more than 100 technical publications and three books. If you have any questions about this article send them to TechTips@sepscience.com


