In an earlier article (#88) we looked at the need to use a matrix-based calibration curve so as to correct for low recovery when extracting an analyte from a sample matrix. To do this, we used a blank matrix and spiked in known concentrations of reference standard to create the calibration samples. But what happens if a blank matrix is not available? For example, if you are measuring the vitamin content of a vitamin-fortified food product, you may not be able to obtain that product without any vitamin if the vitamin is normally present in the non-fortified product. In such cases, you may need to use the method of standard additions. Let’s see how this works.
Standard Additions
The method of standard additions is quite simple in principle, but usually is more work than a method that relies on a calibration curve based on spiked blank matrix. This is because the analyte is always present. We take advantage of this in the method of standard additions by adding known amounts of reference standard to the sample and analyzing the resulting samples.
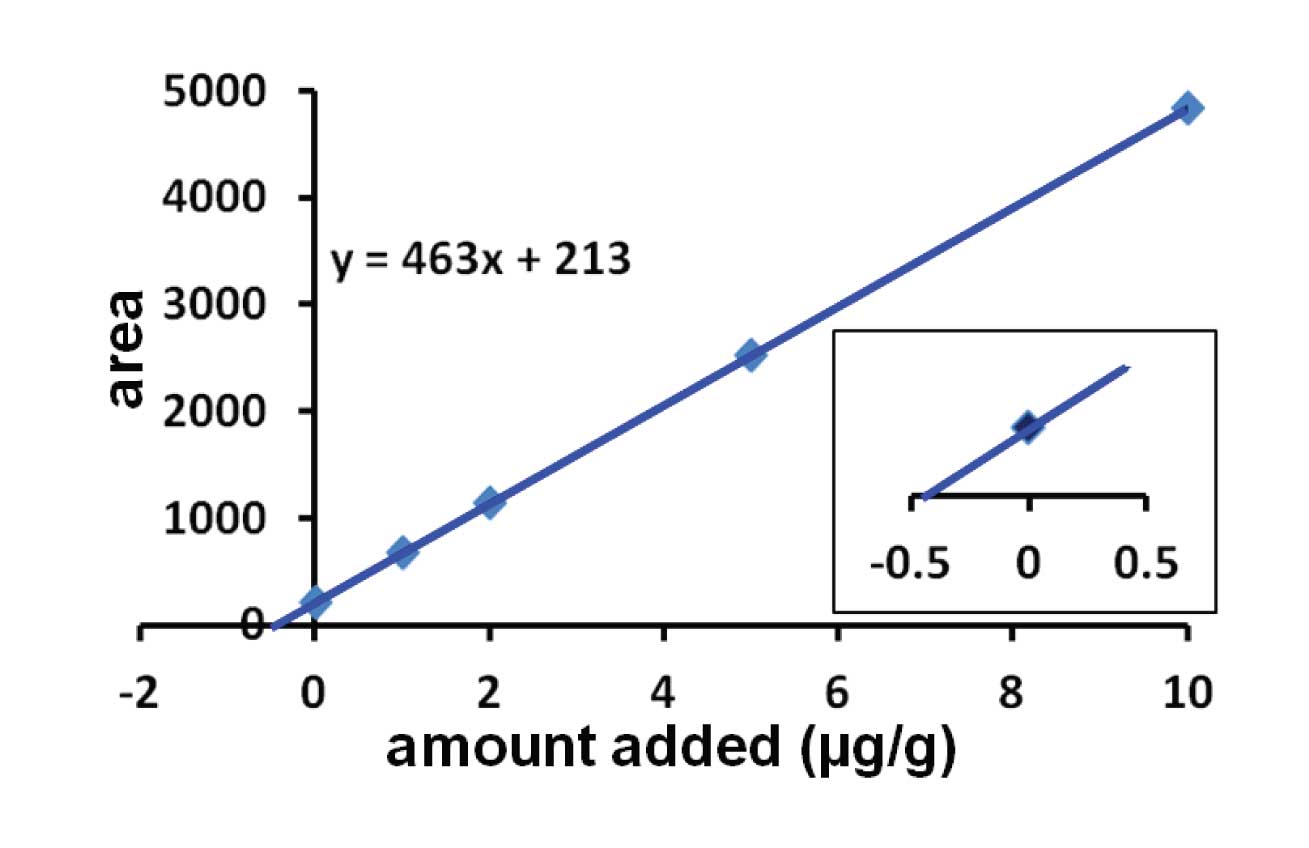
I’ve show results from a hypothetical example in Figure 1. In this case, the sample was divided into 5 parts. One was left untreated, and the remaining parts were fortified with 1, 2, 5, and 10 µg of the analyte per g of matrix. Each portion is then extracted in the normal manner and injected. You can see from the larger plot of Figure 1 that the line crosses the x = 0 axis at y > 0, which is expected, because when no additional analyte was added, only the native analyte is present. We need to figure out how much analyte this represents. Next, the regression line is calculated for the 5 samples. In this case, the regression line was y = 463x + 213. To determine the amount of analyte in the unspiked sample, set y = 0, so x = -213/463 = -0.46 µg/g. Drop the negative sign and we now know that the native concentration of analyte was 0.46 µg/g.
This is the same as the intersection of the extrapolated trend line with the x-axis, as shown in the inset of Figure 1.

Figure 1
Simplifying the Job
It is obvious that there’s a lot more work in using the method of standard additions than if a separate calibration curve is used. This is because a calibration curve needs to be constructed for each sample with standard additions. So it is worth investigating anything that we can do to reduce the workload while still retaining sufficient data quality. Two of these areas are the number of spikes that need to be run and the extraction method.
If you can demonstrate, during method development and validation, that a single spiked sample can be run in addition to the unspiked sample, the number of samples that need to be prepared would be reduced. In the example of Figure 1, 5 separate samples were prepared and analyzed. This takes preparation time and analysis time, both of which add cost to the process. If it could be determined, for example, that the equivalent results could be obtained by splitting the sample in two parts and spiking only one, such as at 2 µg/g, the workload would be greatly reduced.
In the example of Figure 1, we split the sample, spiked the aliquots, extracted them, and analysed them. It may be possible to get equivalent results by extracting a single, untreated sample and then spiking the extracts with reference standard. This would simplify the extraction workload if equivalent results could be obtained.
The method of standard additions may seem foreign to those of you in the pharmaceutical industry, but it may be the only way to analyse samples, such as many foods or other natural products, that never are free of the analyte.
This blog article series is produced in collaboration with John Dolan, best known as one of the world’s foremost HPLC troubleshooting authorities. He is also known for his research with Lloyd Snyder, which resulted in more than 100 technical publications and three books. If you have any questions about this article send them to TechTips@sepscience.com


