
Since 2018, nitrosamines have been a topic of concern across the pharmaceutical market, with numerous recalls issued and testing needed across multiple drug products. Concerns for human well-being have arisen due to the genotoxicity of some nitrosamine compounds demonstrated in animal studies. To alleviate these concerns, nitrosamine levels must be regulated and controlled through analytical methods such as LC-MS. This monitoring can pose challenges, and in this article, we provide tips, tricks, and pitfalls to avoid when analyzing nitrosamine impurities.
Sample preparation for nitrosamine analysis
Nitrosamines have affected numerous drug products and active pharmaceutical ingredients (APIs) across the pharmaceutical market. The vast landscape of different matrices leads to difficulties in sample preparation, as one drug product is unlikely to act the same as another. This diversity necessitates optimization for almost every new matrix.
Ideally, water can be used as a diluent, as is the case for different sartan products, ranitidine and acyclovir. A simple cleanup procedure that consists of centrifugation and filtration to remove insoluble material can be easily achieved. The use of water as a diluent and the performance of a cleanup procedure can limit any mismatch with the chromatographic eluents and enable Gaussian peak shapes.
Depending on their formulation, certain products, such as metformin, can interact with water to become a gel. In these cases, water cannot be used as a diluent. Methanol or other organic diluents must, therefore, be used for preparation, which can limit the limit of detection (LOD) and limit of quantitation (LOQ) of the method due to poor peak shapes. Unfortunately, this is difficult to rectify, and instruments with higher sensitivity or higher injection volumes are needed. These complications can lead to more issues due to higher matrix interference, the need to clean the mass spectrometer more frequently, or the overloading of the HPLC column used for separation.
Instrument optimization for nitrosamine analysis
The relatively low molecular weight of some nitrosamine impurities can pose challenges due to limited fragmentation opportunities and because higher interferences are typically observed at lower molecular weights. In most cases, these issues can be overcome through instrument optimization. First, correct optimization is necessary for compound-dependent parameters such as collision energy (CE) and collision cell exit potential (CXP), which are both measured in volts. These parameters tend to perform similarly across most compounds and typically do not cause problems. In contrast, atmospheric chemical ionization (APCI), which is the standard ionization technique for nitrosamine analysis, requires a flow rate of at least 100 µL/min for optimal performance, compared with electrospray ionization (ESI), which is typically performed at a flow rate of 5 or 10 µL/min.
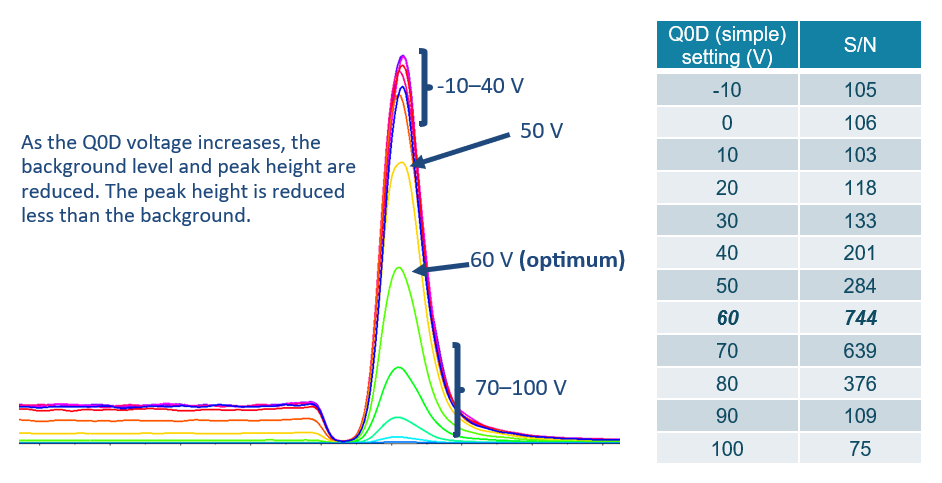
Most importantly, the declustering potential (DP) or Q0 dissociation (Q0D) parameters, which are both measured in volts, must be optimized. Q0D works by applying a voltage between the QJET and IQ0 lens of the system and can be used to reduce interferences. Note that the Q0D parameter is only relevant on select systems, whereas most use the DP parameter. Typically, the optimization of both parameters would be performed by syringe infusion. However, this method tends to provide incorrect optimization values, as it does not account for the background observed when performing LC-MS analysis. As such, because these parameters have a large impact on the background observed, it should be optimized through LC-MS rather than syringe infusion. LC-MS optimization can be performed in a single injection by analyzing the same MRM transition with differing Q0D values. Figure 1 highlights this phenomenon.
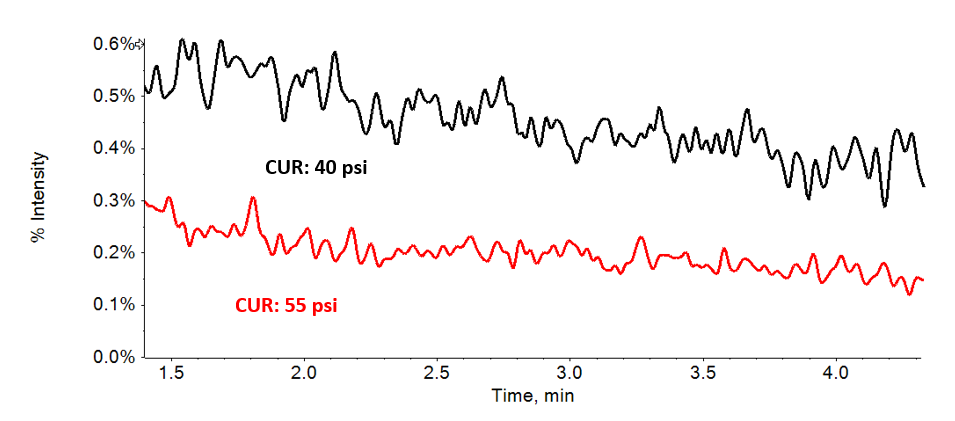
In addition to the DP or Q0D parameter, it is important to optimize the curtain gas (CUR), measured in psi. Curtain gas is a flow of nitrogen, which is blown out of the orifice of the system to reduce system contamination. Higher values can reduce background and improve LOQ values. Figure 2 highlights this reduction.
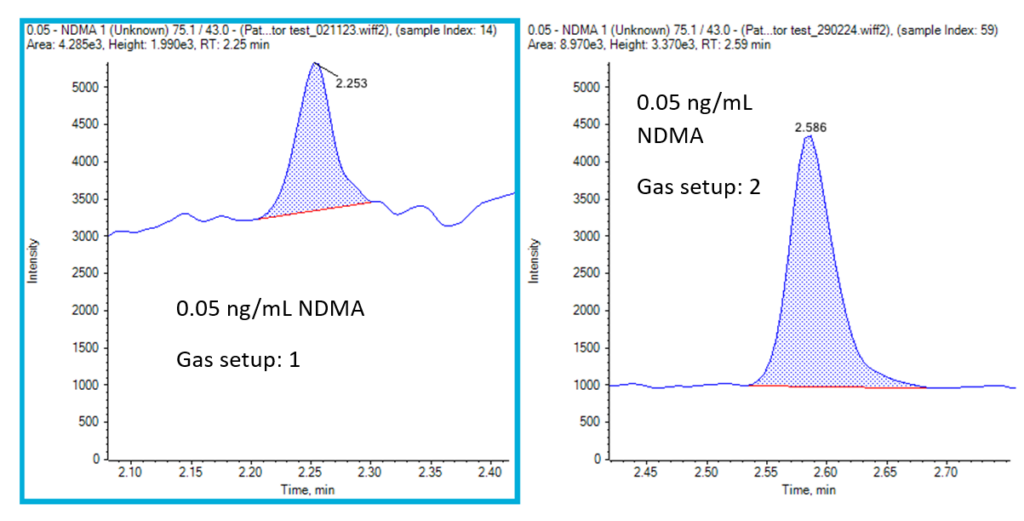
Finally, the quality of the gas delivered to the system can impact the background observed for some nitrosamines. Figure 3 compares two different gas generation systems to demonstrate this effect on the background observed.
Chromatography
Typical column selection for nitrosamine analysis appears straightforward, as several different column phases retain all the regulated nitrosamine compounds and provide generally acceptable chromatography. When analyzing final tablet formulations, however, analyte suppression is observed, and the compounds affected depend on the drug product analyzed. Therefore, the chromatographic gradient must be optimized between different formulations and products.
A single chromatographic gradient is possible for similar products, such as multiple sartan APIs and drug products. Even in these cases, however, some optimization might be required. Due to this optimization, it is important to use a column that tends to fit the needs of the analysis and different matrices. In this case, our group has decided to start most method development using a biphenyl stationary phase due to its ability to retain NDMA better than a C18 column. A column with a 150 x 4.6 mm length and 2.6 µm particle size can allow for increased loading of the API or drug product when necessary. Despite these advantages, this column choice reduces throughput by increasing typical runtimes to 15–30 minutes. In some cases, narrower columns and smaller particle sizes can be used to reduce runtimes. However, the use of a narrow column with a small particle size can also result in a less robust method with more frequent column blockages and overloading due to the high sample loads.
Conclusion
To summarize, nitrosamine analysis is amenable to LC-MS analysis. With a few tips and tricks, nitrosamine analysis can easily be implemented for routine analysis with high levels of sensitivity and robustness.
References